Email Marketing Benchmarks Archive: June 2020
Date Updated August 1, 2020
We kicked off 2020 with no idea what was in store for us—full of hope and promise, the new year was off to a great start for marketers. Since then, things have gone a bit…well, 2020 on us.
The Email Marketing Benchmarks Report for the first half of 2020 is unlike any we’ve seen before. One of the unexpected impacts of the COVID-19 pandemic and subsequent shutdowns is the fact that email has suddenly become the “it” channel (email marketers reading this, we know you’ve always thought that and so have we, but what’s important here is that non-email marketers are coming around to the fact that email is a high performing, relevant, awesome way to communicate with our audiences).
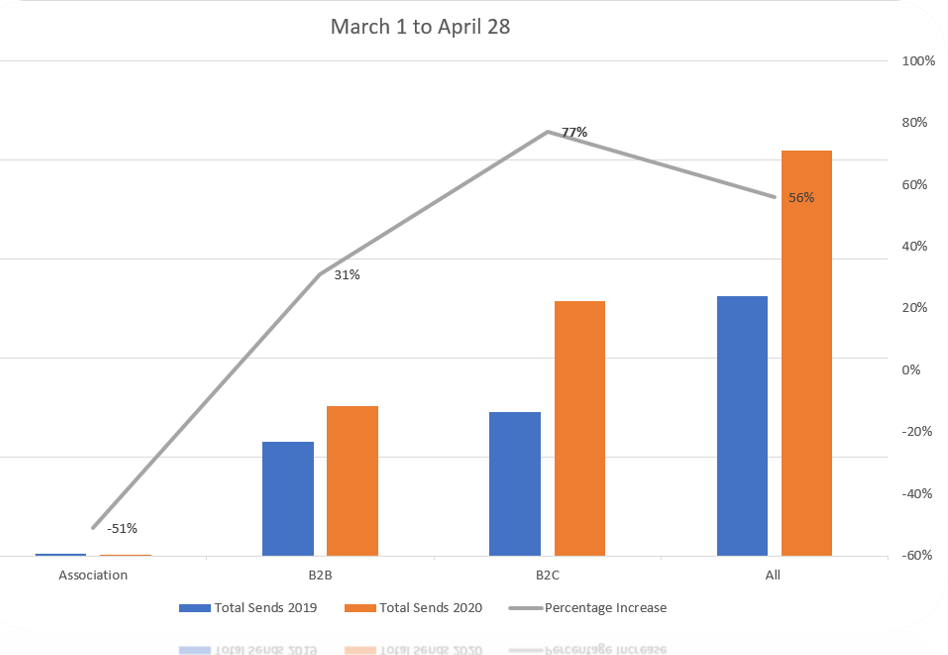
Taking a look at just the volume of email sent through the emfluence Marketing Platform during the period of nationwide shutdowns, you can see that most companies were sending significantly more email than in the same time period the year before:
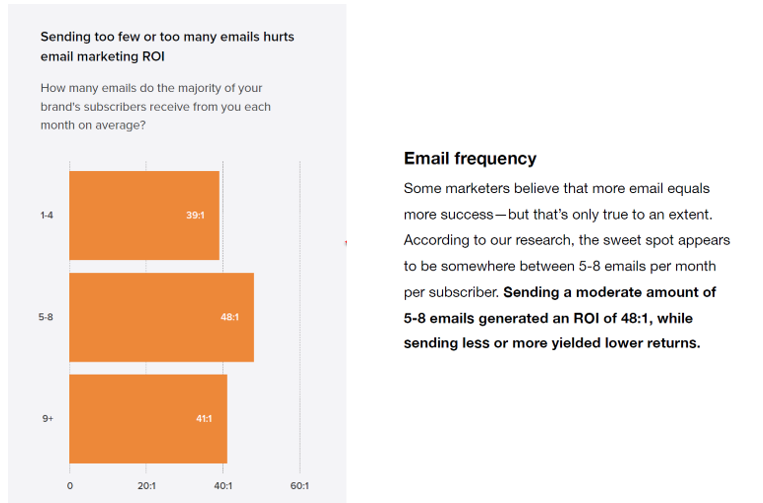
In normal years, an increase in frequency would typically lead to a lack of engagement with email subscribers, as you can see here in Litmus’ 2019 State of Email Report:
But this year, despite the major jump in the number of emails sent, we haven’t seen any significant impact on engagement rates. Perhaps it’s the fact that email is easily accessed no matter where you’re working from, ready when you want to read it (versus the inconsistency of timing with the social scroll), or serves as a subtle nudge that your favorite brands do still exist. Whatever the reason, 2020 is definitely a year for email to shine. Let’s take a look at the first half of our 2020 Email Marketing Benchmarks Report, which runs from Jan. 1, 2020 to June 30, 2020:
Average Email Marketing Metrics by Industry
Our average email marketing metrics by industry report demonstrates that quite a few industries saw an uptick in unique open rates during the first half of 2020:
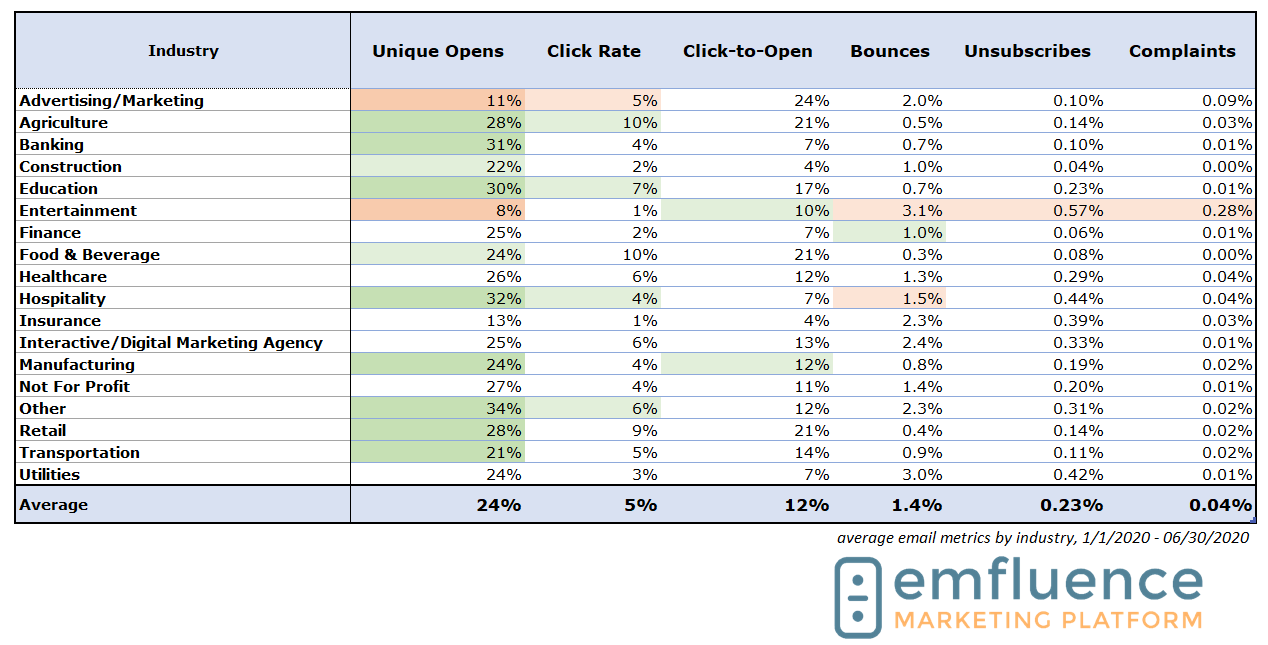
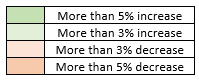
Agriculture, Banking, Education, Hospitality, Manufacturing, Retail, and Transportation saw unique open rates that were in some cases more than 5% higher than in our previous 2019 Report. Entertainment saw a significant decrease in unique open rates (from 15% to 8%)—perhaps unsurprising during a time that saw cancellations in events and entertainment venues across the country. Traditional Advertising/Marketing also saw a big drop in both unique open rates and click rates during the first half of 2020.
Engagement rates, however, held strong, despite the increase in volume of email. Some industries, like Agriculture, Education, and Hospitality, saw small upticks in click rates and click-to-open rates, with top performers in engagement (measured here as click-to-open rates) were consistent with previous year reports:
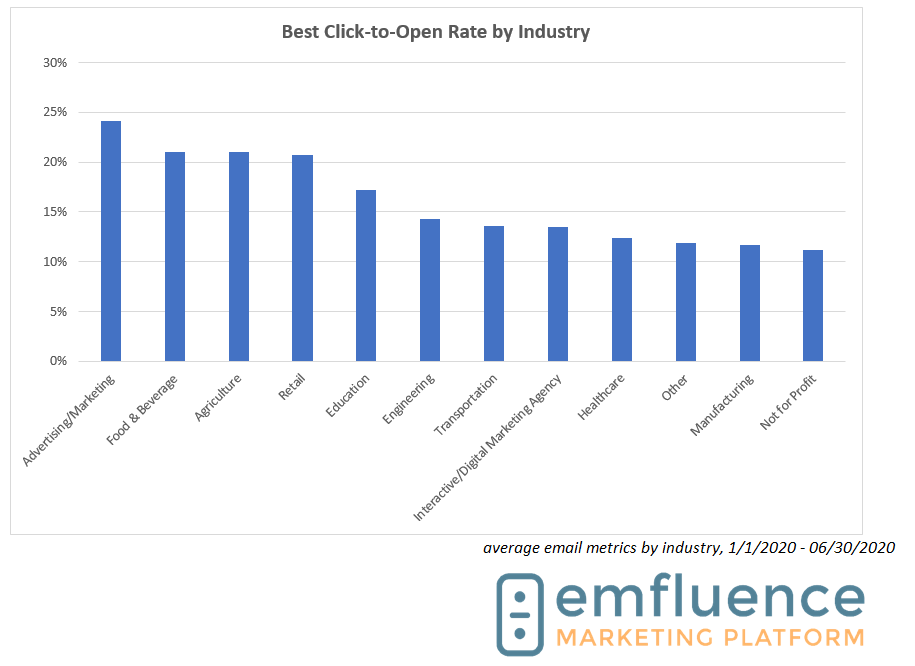
Food & Beverage, Retail, and Agriculture maintained their high engagement marks, whereas Not for Profit and Healthcare saw small drops over previous reports.
In this report, there were few major changes for bounces, unsubscribes, or complaints, with only Entertainment and Hospitality seeing upticks in unhappy recipients.
As previously mentioned, the emfluence Marketing Platform saw an increase in the number of emails sent through our platform during the COVID-19 nationwide shutdown window (which we defined as March 1 through April 28 for the purposes of this report). Retail, Banking, Insurance, and Agriculture tend to send the most volume during normal times, and this was no different in the 2020 report:
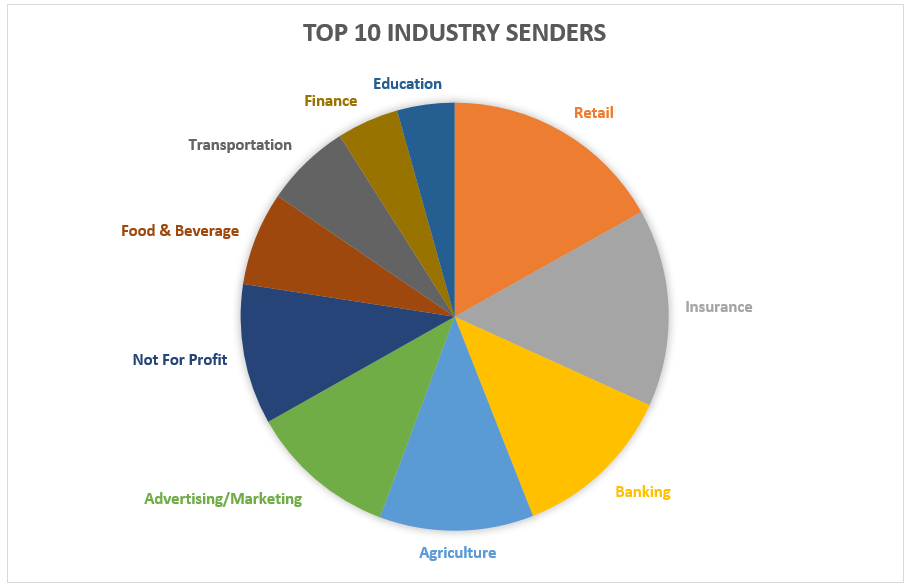
No major changes here, with the exception of Education replacing Manufacturing—perhaps another impact of COVID-19 as schools required more emails to stay in touch with prospective and existing students.
B2B Email Marketing Metrics
B2B email is definitely its own ballgame—often it’s more difficult to measure a direct ROI, and the goals of each email type tend to change depending on audience (you can read more on all things B2B email here, by the way).
COVID-19 has tossed B2B marketers into a sea of marketing uncertainty as well—from cancelled tradeshows to inconsistencies on where and when prospects are working, email has become one of the few reliable touchpoints for marketing and sales teams during this pandemic.
Let’s see how that translates in email engagement rates for the first half of 2020:
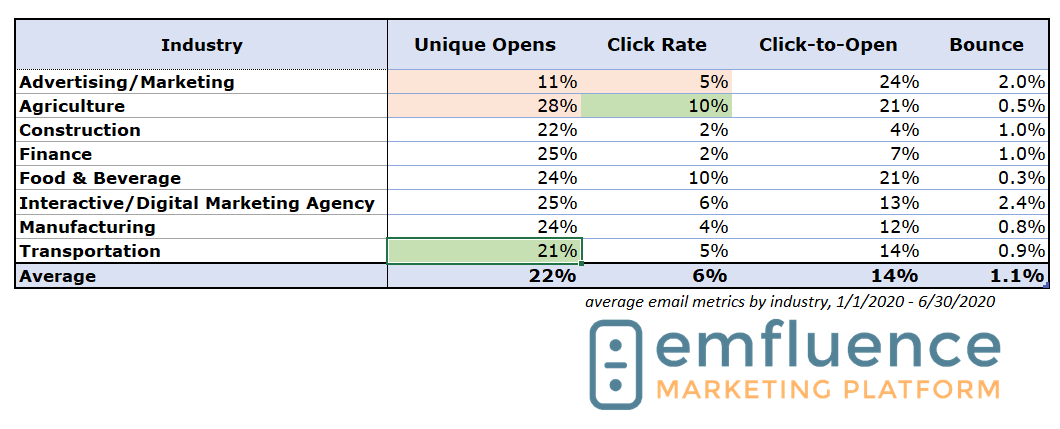
Only two industries saw dips in unique open rates (Advertising/Marketing and Agriculture), although interestingly, Agriculture’s click rate jumped over our last report. Transportation saw a big increase in unique opens (from 15% to 21%), which could be attributed to all of our online shopping habits and the corresponding jumps in the number of items needing shipment.
Comparing our B2B rates with our B2C rates, and you can see that B2C email had a lot of interest in the first half of this year:
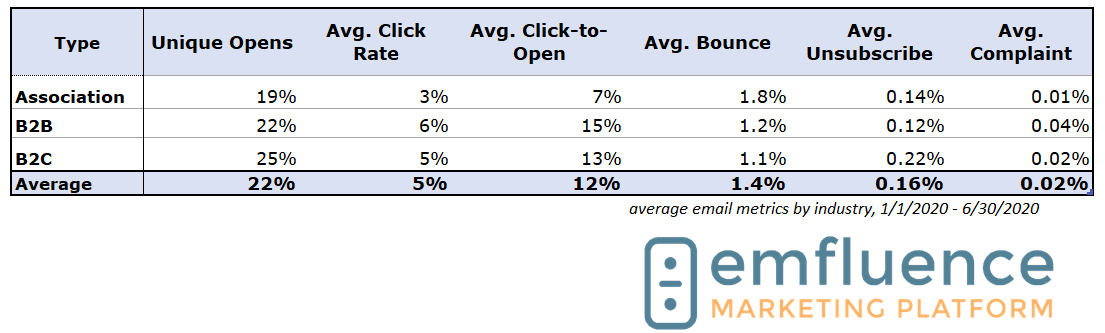
In our last report, B2C email as a category averaged a 20% unique open rate, and B2B email averaged a 19% open rate—matching our industry trends, however, is that the average click rates and average click-to-open rates were not significantly impacted (negatively or positively).
Impact of COVID-19 on Email Marketing
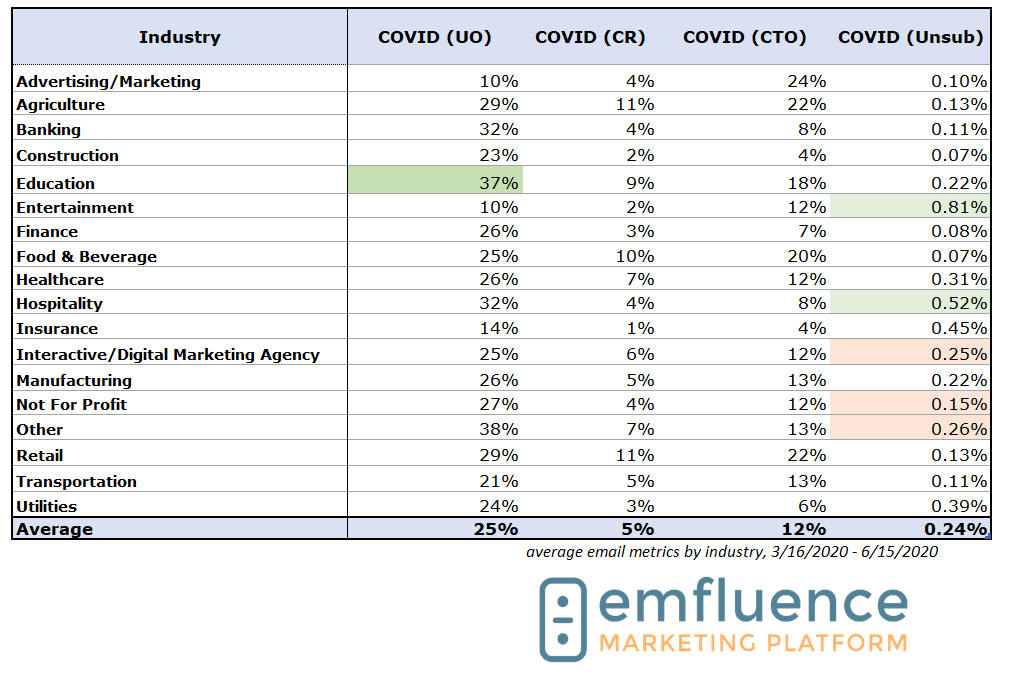
Looking at COVID-19 metrics from a slightly expanded timeline, between March 16 to June 15, you can see that by industry, there are small upticks in unique open rates for Education and no other major changes to report. Since we’re email geeks, we’re using this as evidence that email is a great channel for communication during extended periods of uncertainty—particularly since our inboxes are receiving about as much email now as we typically would during the holiday shopping email season:
Don’t Love Your Email Results?
Averages for Automated, Manual, and Transactional Sends
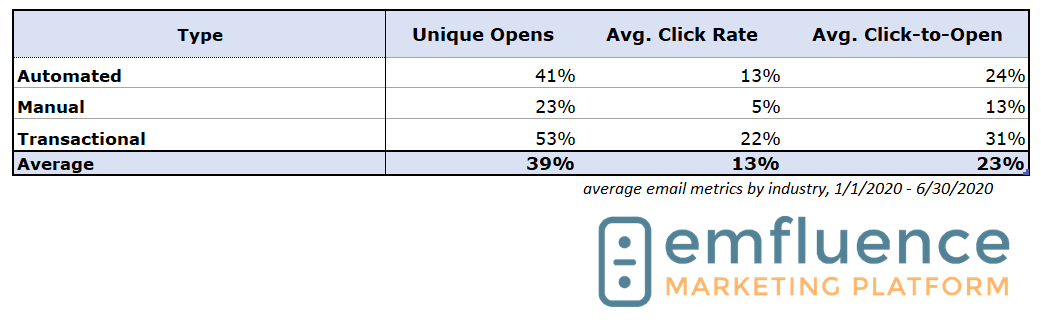
Toward the beginning of the pandemic and subsequent shutdowns, email marketers and strategists far and wide were cautioning marketers about automated emails. Since these are generally set-and-forget campaigns, it was a nice reminder that some of those campaigns were serving up offers that needed to be redeemed in-person or informing recipients of events and happenings that were no longer happening.
Perhaps unsurprisingly, some people forgot to review their automated campaign offers, and as a result, we saw a downturn in automated email engagement that we haven’t seen before—the average click rate in our last report for an automated email was 23%. Transactional emails, however, saw a big increase in engagement, jumping from an average click-to-open rate in our last report of 23% to an average of 31% in this report:
Conclusions
2020 might be the year the phrase “email is dead” finally dies. That doesn’t mean, however, that you should blast your lists with every offer. As you make plans for how to address email strategy in the coming months, we recommend the following resources:
- Track your ROI on email beyond clicks and opens with this guide to Email ROI.
- Get our tips on revamping your email strategy during global periods of disruption here.
- And if you need some inspiration, we always recommend the awesomeness of Really Good Emails.
Metrics definitions for our benchmarks:
Open Rate – Unique openers divided by total number of emails sent.
Click-through Rate – Total number of clicks divided by total number of emails sent.
Click-to-Open Ratio – Of those who opened the email, what percent clicked.
Bounce Rate – Total number of hard or soft bounces divided by the total number of emails sent.
Unsubscribe Rate – Total number of people who unsubscribed divided by the total number of emails sent.
Complaint Rate – Total number of spam complaints divided by the total number of emails sent.
See our archived email marketing benchmarks:
December 2019
June 2019
December 2018
June 2018
December 2017
June 2017
December 2015
June 2015
December 2014
Ready to get started?