Email Marketing Benchmarks Archive: December 2014
See the latest email marketing benchmarks here.
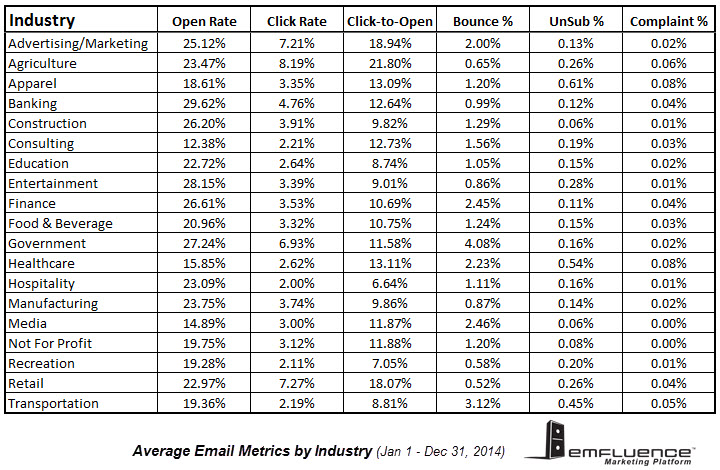
Though we always say your best comparison in email marketing is to your own historical campaign benchmarks, email marketers are always curious how they stack up against others in their industry. We’ve wrapped up the report for our clients’ average open rates, click-through rates and more, broken down by industry, and found a few interesting trends:
Don’t Love Your Email Results?
Download the anatomy of a marketing email template
Banks, Entertainment and Government had some of the highest open rates in 2014. All were above the often quoted average of 20-25%.
Agriculture and Retail drove the highest click-through rates in 2014. They also had the highest Click-to-Open percentages, both over the global benchmark of around 15%.
In 2014, Retail and Recreation had the lowest bounce rates at less than 0.6%! Typically the “safe range” for bounces (hard and soft combined) is under 3.0%.
Particularly noteworthy: emfluence clients in the Media and Not for Profit industries maintained a 0% complaint rate for the entire year of 2014. That’s unheard of in other industries — accidents and false positives happen — but can happen when recipients expect to hear about the cause they support.
Email Marketing Benchmarks by List Size and Automation
We also sifted through the metrics by total list size, to see how that impacts average open and click through rates. Not surprisingly, the larger the list, the more the open and click through rates seem to taper off. Smaller audiences tend to be more “inner circle” and more likely to engage. An interesting anomaly, though: the click-to-view rate — the measure of how many openers went on to click — doesn’t see to pay any attention to list size and, in fact, seems to burst for larger list sizes:
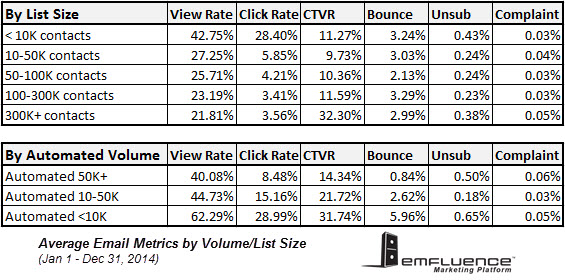
The same trend was clear for Automated emails, segmented by estimated annual volume. If a marketer is sending more than 50,000 automated emails a year, they can expect around a 40% open rate and 8.5% clickthrough rate. If they’re sending fewer than 10,000 automated messages a year, those numbers jump to 62% open rate and 29% clickthrough rate! Even the click-to-view rate seems to improve with smaller and presumably more targeted sends.
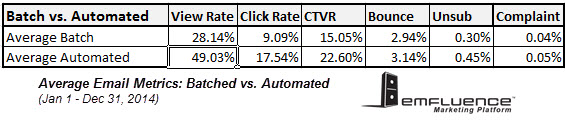
Predictably, automated emails, sent in the recipient’s time, not the sender’s, significantly outperforms batched emails. The volume is much less in most cases, but more importantly, automation allows an email to reach a customer at the time that makes the most sense to them. From abandoned shopping cart reminders to the good old fashioned welcome email, these are the way to your email subscriber’s heart (and wallet).
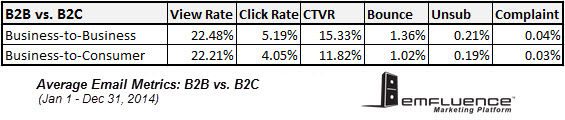
And finally, a surprise we found in the data. There didn’t seem to be a big difference between business-to-consumer and business-to-business email marketing. The trends seemed more impacted by how a marketer acquired contacts and how old those contacts were, more so than whether the product was for business or personal life.
Eager for more benchmarks? We follow Marketing Sherpa’s Benchmark Guide each year, too. (The latest edition they have is from 2013, but it may still hold some gold.)
Ready to get started?