Email Marketing Benchmarks Archive: June 2018
See the latest email marketing benchmarks here.
Summer is in full effect, which means it’s time to take a breather from those out-of-office replies and take a look at email marketing benchmarks for the first half of 2018.
If this is your first Email Marketing Benchmarks Report, this is our twice-yearly dive into the email marketing metrics compiled by the global users of the emfluence Marketing Platform. These email marketing benchmarks are designed to give you a starting point for comparing your own email marketing metrics. You’ll be able to scroll through comparison metrics based on industries, audiences, and messaging styles.
Let’s take a look at email marketing benchmarks for the first half of 2018.
Average Email Marketing Metrics by Industry
The good news across most industries: after the holiday season influx of emails, engagement and open rates have largely returned to normal (haven’t seen the Email Marketing Benchmarks 2017 Part Two Report? See how the holidays impacted email metrics in the second half of 2017).
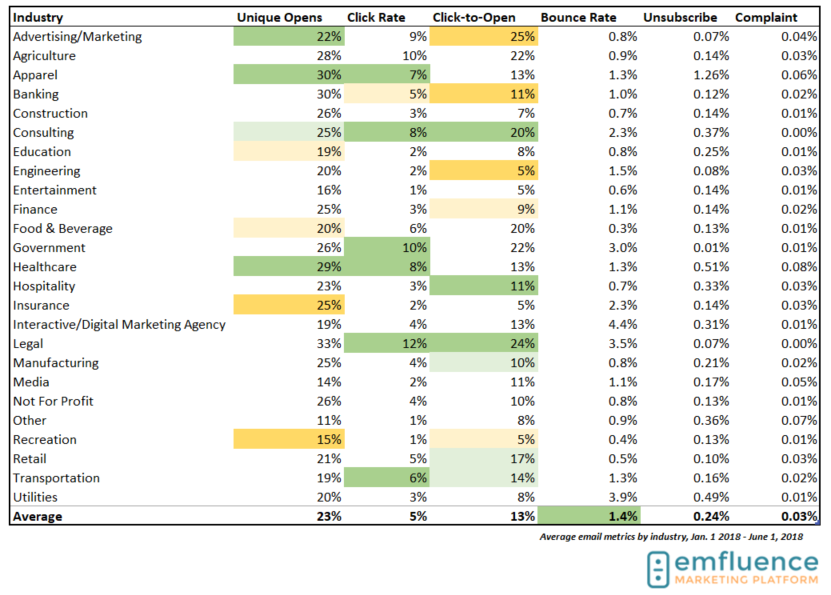
The first half of 2018 is a story of engagement, with a good portion of industries improving on this portion of the year’s engagement rates over all-time engagement rates. In the chart above, dark green indicates positive improvement (four or more percentage points) when compared to the previous report (second half of 2017) and all-time averages. Light green indicates slight improvement (two or three percentage points), light yellow indicates a slight decrease (two or three percentage points), and orange indicates a significant decrease of four or more percentage points when compared to the previous report and all-time averages.
Across the board, Open Rates climbed from an overall average of 21% in the second half of 2017 to 23% in the first half of 2018, Click-to-Open rates climbed from an average of 11% in the second half of 2017 to 13% in the first half of 2018, and Click Rates climbed 1% in the same time frame. For Open Rates, 23% is a return to the first half of 2017 Open Rates—indicating that the influx of November and December email could be contributing to slightly lower Open Rates in the second half of the year (email fatigue at work).
Email Engagement by Industry
Apparel had a great first half of 2018, with Unique Opens climbing to 30% over their historic average of 23%. Add in a jump in Click Rates from a historic average of 4% to 7% in the first half of 2018, and it’s safe to say that Apparel is headed in the right direction with their email marketing. Perhaps consumers are growing more accustomed to purchasing apparel through online services—which means Apparel marketers could ramp up email-driven sales even more through abandoned cart email campaigns, list segmentation strategies, or incorporating social media into their ecommerce sites.
Want to walk through an ecommerce + abandoned cart email strategy in real time? Check out our t-shirt shop!
Healthcare had a great first half of 2018 as well, with an 8% increase in Unique Opens and double the Click-to-Open rate they saw in the second half of 2017. Legal’s Unique Opens were flat in this time period, but the industry has doubled its Click-to-Open rate over the same time period last year, which is a good indicator that the content served up in each email is relevant to the audience. Hospitality saw a similar trend, with flat Unique Open and Click Rates but almost double the percentage of Click-to-Opens as the industry saw during this period in 2017. And one more industry that saw improved engagement rates—Consulting increased Click-to-Opens from 11% this time last year to 20% in the first half of 2018.
What’s the secret to increased engagement? Obviously there are lots of factors at work, but it’s possible to see these jumps in engagement when you:
- Create relevant content and/or offers specific to your audience
- Segment your lists based on interest
- Send at a reasonable rate per month (not too often, not too little)
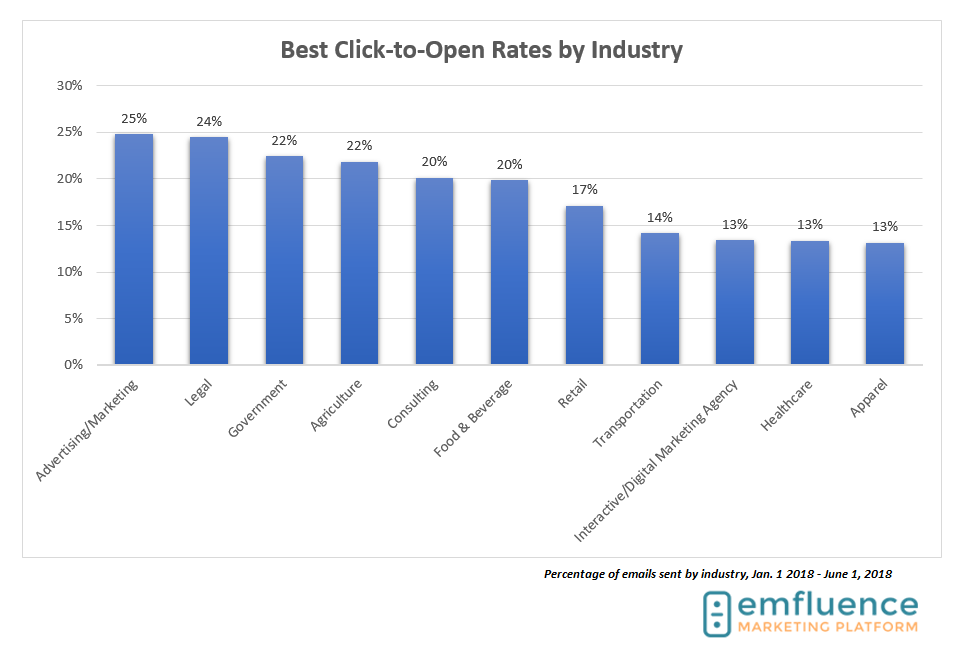
Not every industry saw improvement during the first half of 2018, however. While Advertising/Marketing held strong with one of the highest engagement rates of all industries, Click-to-Open rates actually fell from an all-time average of 30% to 25% in the first half of 2018. Recreation’s Click-to-Open rates fell from 8% to 5%, and Unique Opens took a hit as well: from an all-time average of 19% to a first-half 2018 average of 15%. And Engineering saw a similar dip, with Click-to-Open rates falling from an all-time average of 11% to a first-half 2018 average of 5%.
Most Email Sends by Industry
The Email Marketing Benchmark Report also allows us to see which industries are sending the most email, like so:
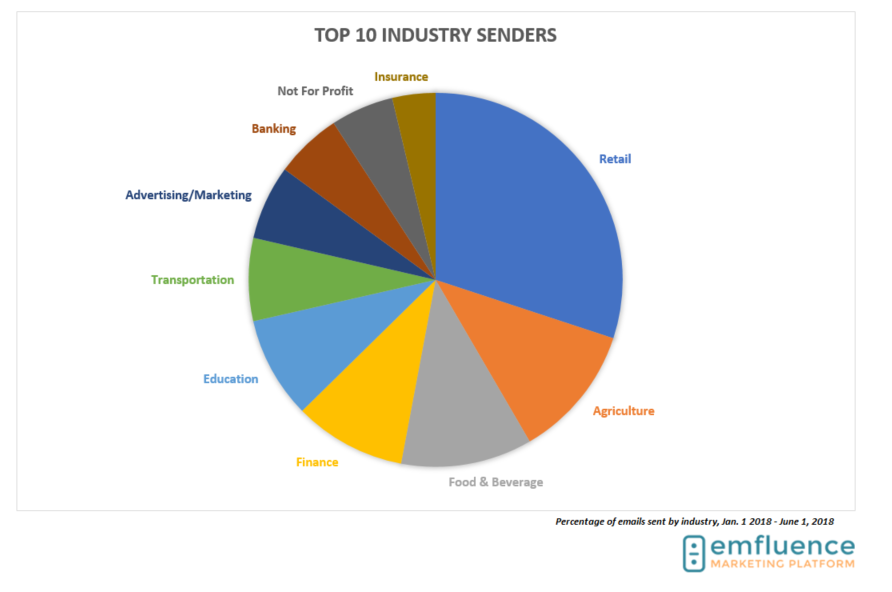
The top industry sender in the first half of 2018 is Retail, with Agriculture and Food & Beverage following close behind. Examining percentage of sends can help us identify the impact of a large quantity of sends on a given industry’s engagement rates, and if you compare Retail’s high percentage of sends to their engagement rates, things are looking up: Click-to-Open rates (as noted above) are climbing, and Bounces, Unsubscribes and Complaints are all respectively below the overall average. Way to go, retailers!
The Bounces, Unsubscribes, and Complaints by Industry
The top Bounce rate in the first half of 2018 goes to Interactive/Digital Marketing, which means it’s time to do some list cleansing, fellow marketers. However, Utilities, Legal, and Government had Bounce rates above the 3% mark, which means list cleanses are in order for those industries as well—remember, a clean list will help you land in the inbox (if you need help getting your list cleansed, don’t hesitate to reach out to us).
Remember those climbing engagement rates for Apparel? Take note, then, that this industry actually had the highest percentage of Unsubscribes at 1.26%, and the third highest Complaints percentage of all industries at 0.06%. High Unsubscribes and high Complaint rates typically indicate a problem with opt-in strategy. This could be anything from purchasing lists (click here to see if that’s a good idea) to opting in people against their knowledge (say, during the cart checkout process), to a lack of good segmentation in the offers you’re sending your email subscribers. So while things are heading in the right direction for Apparel, there’s still lots of room to grow.
As for other industries who might want to reevaluate how they are obtaining email addresses, Healthcare had the highest percentage of Complaints at 0.08%, and one of the top three highest Unsubscribe rates at 0.51%. Utilities had a high Unsubscribe rate as well, sitting at 0.49% over the overall average of 0.2%.
Legal and Consulting each had a Complaint rate of 0%–way to send to people who expect your emails!
Averages for Automated, Manual, and Transactional Sends
In our last Email Marketing Benchmark Report, we cited an estimate from Litmus that fewer than 5% of all marketing emails sent are automated emails. The numbers from the first half of 2018 show there’s still room to grow. Even though automated emails have the highest ROI and the lowest spam complaints and unsubscribes, the benchmarks show that senders who are strictly B2B are sending 2% of all emails as automated and nearly 96% as manual emails. On the strictly B2C side, automated emails account for 3% of all sends, whereas manual emails account for 58% of sends. (Keep in mind not every sender is strictly B2B or B2C, and transactional emails account for additional percentages).
The most compelling case to add more automated emails to your strategy? Take a look at the numbers below:
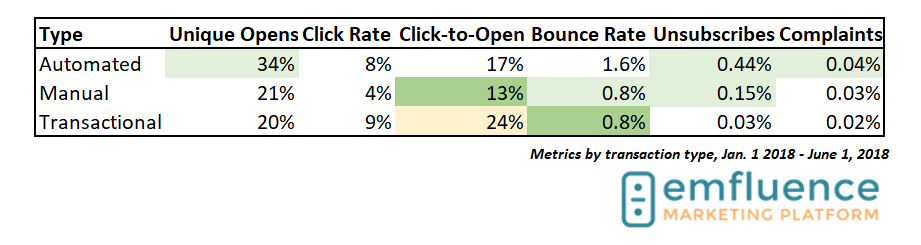
On average, Automated emails had a 34% Unique Open rate (up from 32% in the previous report) and a 17% Click-to-Open rate. That’s not to say that Manual and Transactional emails shouldn’t be part of your strategy, but automation is a great way to stay top of mind, and top of wallet.
Need ideas for adding automated emails to your email marketing strategy? Sign up for our monthly newsletters and get suggestions delivered directly to your inbox.
Banking/Finance and Retail were the industries sending the bulk of their email manually, while Education was the industry sending mostly automated emails.
Averages for B2B and B2C Email Marketers
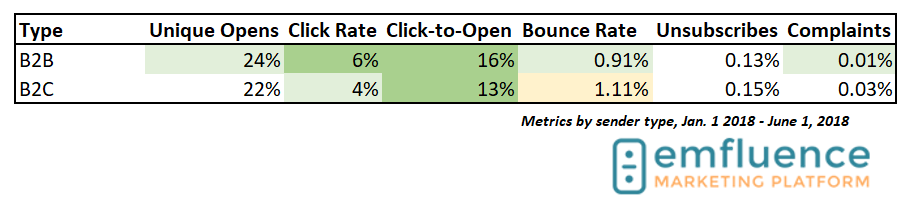
As noted above, B2C marketers were far more likely to use automated emails than B2B marketers were in the first half of 2018. Looking at Unique Opens by sender type, we can see a slight increase in metrics across the board for B2B marketers, including a 2% jump in Unique Opens, a 3% jump in Click Rate, and an almost 5% jump in engagement. Bounces and Complaints were down for B2B marketers as well. In our last Email Marketing Benchmarks Report, we talked about running regular list cleanses to account for the 25% loss of B2B email addresses as a way to combat the Bounce Rate—clearly a few readers were listening!
For B2C marketers, engagement improved two percentage points in Click Rate and almost five percentage points in Click-to-Open, but the overall Bounce Rate increased slightly from 0.8% to 1.11%.
2018 Email Marketing Trends
Now that we’ve taken a look at the Email Marketing Benchmarks for the first half of 2018, let’s put together an action list of how you can improve your individual metrics in the second half of the year. If you haven’t done so already, try putting the following into place:
- More Automation—not only will this make your life easier, but you can string together complex campaigns that make targeting and sending the right content at the right time so much easier.
- Milestone Emails—are all the rage this year. These emails are based on the unique value each individual customer is getting, and they are highly personal. Learn more about them here.
- Focus on Engagement—meaning, create emails and offers your audience wants to receive, and test to make sure you aren’t sending too frequently or infrequently.
- Incorporate Customer Service and Customer Communications into the Mix—you can use automation to create upsell & cross-sell campaigns, review campaigns, and survey automation.
- Segment Your Lists—targeted emails generate 58% of all email revenue, according to the DMA. It’s no surprise, either: people are more likely to buy things from you they’ve already shown an interest in.
- Start an Abandoned Cart Workflow—yes, even if you’re B2B (you can use ecommerce, too). Abandoned cart emails are amazing sources of almost-lost revenue. Learn more and try one out for yourself over on our t-shirt shop.
And don’t forget to sign up for our newsletters so you don’t miss more reports like this!
Metrics definitions for our benchmarks:
Open Rate – Unique openers divided by total number of emails sent.
Click-through Rate – Total number of clicks divided by total number of emails sent.
Click-to-Open Ratio – Of those who opened the email, what percent clicked.
Bounce Rate – Total number of hard or soft bounces divided by the total number of emails sent.
Unsubscribe Rate – Total number of people who unsubscribed divided by the total number of emails sent.
Complaint Rate – Total number of spam complaints divided by the total number of emails sent