Email Marketing Benchmarks Archive: December 2017
See the latest email marketing benchmarks here.
Congratulations, email marketers! We made it through the final two months of 2017, that magic time of year when the average inbox sees a 50% increase in email traffic. Now that our inboxes are cleared of flash sales and holiday cards, it’s time to take a look at our Email Marketing Benchmarks 2017 Report for the second half of the year. (Missed Part One? Revisit it here).
If you’re new to the Email Marketing Benchmarks Report, this is our twice-yearly dive into the email marketing metrics compiled by our emfluence Marketing Platform users. It’s designed to give you a starting point for comparing your own email marketing metrics, with emphasis on industries, audiences, and messaging styles.
Let’s see how the second half of 2017 played out:
Average Email Marketing Metrics by Industry
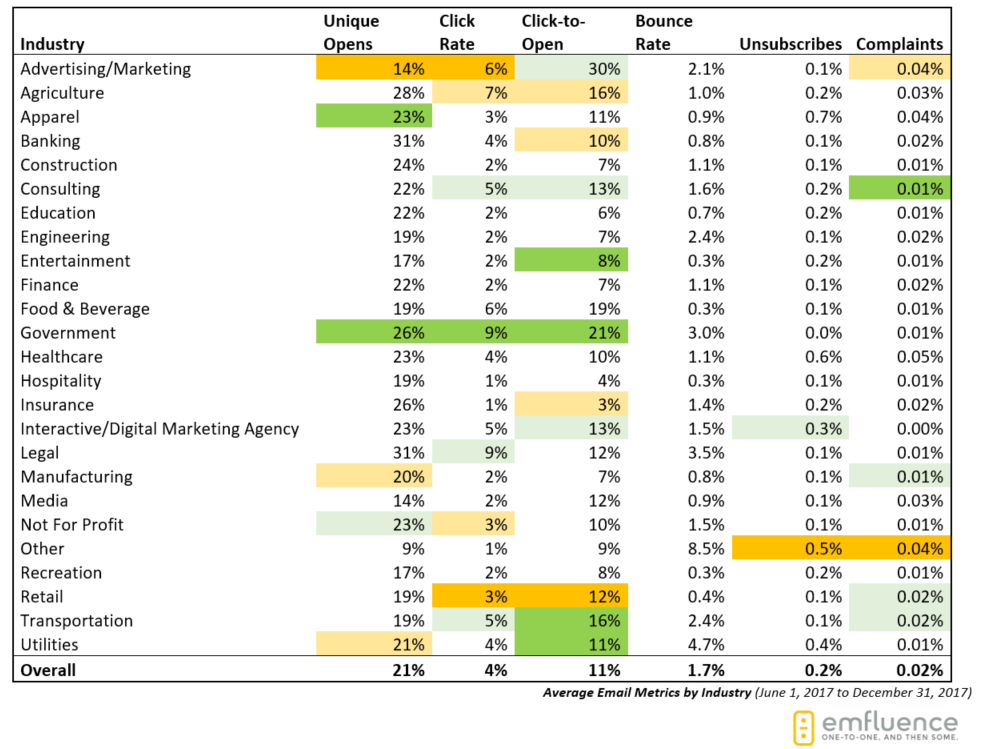
Across the board, almost all industries saw a slight decrease of about 1-2% in open rates over the first half of 2017. When compared to the same time period in 2016, however, open rates were largely the same (with a few exceptions that we’ll get to shortly). Overall, that translated into an average open rate of 21% (versus 23% during the first half of the year), and an average click-to-open rate of 11% (no change from mid-2017).
With the Q4 influx of year-end sales quotas, holiday ecards, and online shopping emails, it’s not uncommon for industries to take a hit in open rates during the second half of the year. Just think about your own inbox—during the peak months of November and December, brands are fighting for space. Email fatigue becomes real, and the brands that do get through to you are the ones doing something special to get your attention.
In the chart above, dark green indicates positive improvement when compared to the previous 2017 Report and the same time period in 2016. Light green suggests small, but noticeable improvement. Yellow indicates a slight decrease in rates, whereas orange indicates a more sizeable downward trend.
The best open rates on this report come from Banking and Legal (31% each), Agriculture (28%), and Insurance and Government (26% each). When compared with mid-2017 and last year’s numbers, Government saw the most improvement in both unique opens and click-to-open rates (21%).
Only Advertising/Marketing had a higher click-to-open rate (30%), although overall unique opens for the Advertising/Marketing industry (14% in this report) were down from 23% in the mid-2017 report. The closely related Interactive/Digital Marketing Agency category maintained a 23% open rate (a slight increase from 21% mid-2017) and an improving click-to-open rate as well (up 3% from mid-2017).
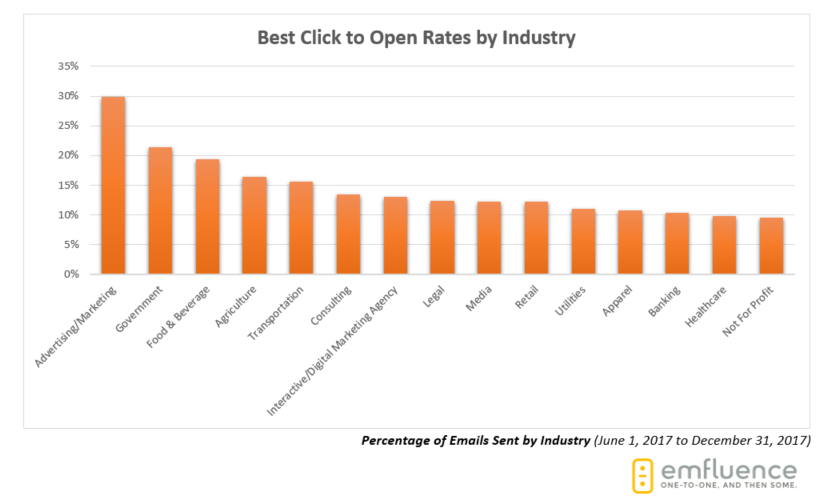
Some of the top performers in engagement metrics are to be expected: Media, which has a high volume of sends year-round, is in the business of providing valuable content that subscribers are likely to engage with. So while Media’s unique open rate is among the lowest of industries sampled, their engagement rates are in the best performers. Food & Beverage, which averaged a 19% click-to-open rate in the second half of mid-2017, tends to send emails that would entice diners and consumers to click to receive the offer or to schedule a reservation. And while Retail and Apparel still made the top of the list for engagement, their click-to-open numbers actually fell slightly—which could be a signal that their messages weren’t doing enough to stand out from the influx of holiday emails.
We can also use this report to measure which industries are sending the most email, and how that impacts their recipients’ annoyance factor—their complaint rates.
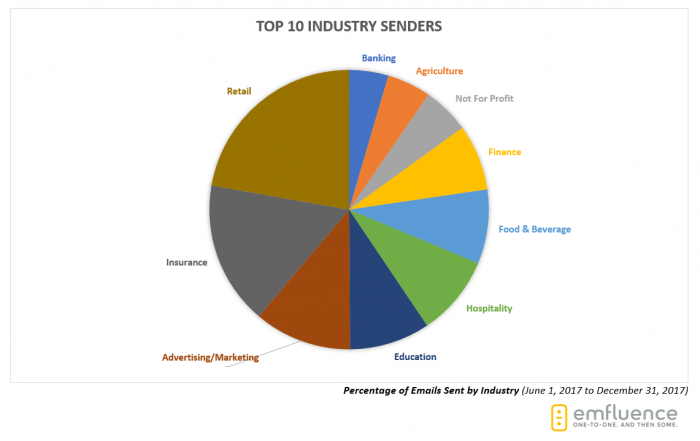
As with the first half of 2017, the Retail industry is sending the majority of emails, followed by Insurance, Advertising/Marketing, Education, and Hospitality. Even though Retail sent the highest number of emails, the industry maintained an impressively low complaint rate of 0.02%, which indicates that the people who receive their emails likely signed up for them in the first place. Way to go with that opt in strategy, Retailers!
The top offenders in the complaints category were Advertising/Marketing, Apparel, and Healthcare, which suggests these industries could revisit how they are acquiring emails and if they are delivering the kinds of messages their subscribers want.
Only one industry on this year’s list averaged 0.00% complaints—Interactive/Digital Marketing Agency.
The Impact of the Holidays
Online shopping hit an all-time high in 2017, with season online sales totals expected at more than $100 billion. If we compare the number of emails sent in the months of November and December to the rest of 2017, it’s clear that the final two months of the year are more important to some industries than others.
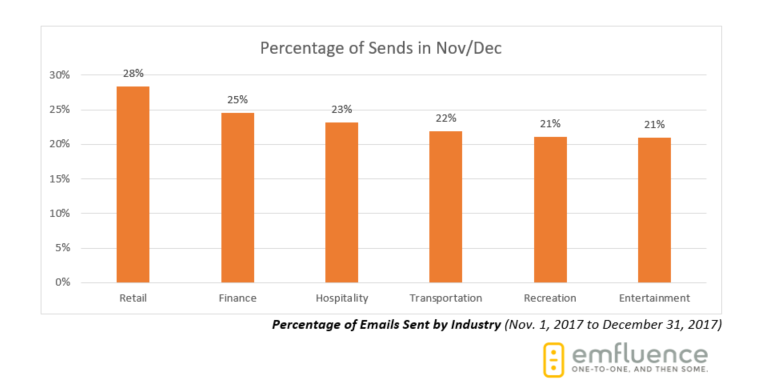
Not surprisingly, Retail sent 28% of all 2017 emails in November and December. And since someone has to deliver all of those packages ordered online, it’s not surprising to see Transportation sending more emails in November/December as well. The uptick in Hospitality, Recreation, and Entertainment could also be related to the holiday season, where senders could be targeting recipients looking for other ways to spend time with family or unconventional gift ideas.
Interestingly, Not for Profit, which often promotes year-end giving campaigns during the months of November and December, didn’t have any significant changes in the amount of email sent or engagement rates for the emails they were sending.
Averages for Automated, Manual, and Transactional Sends
Even though automated emails bring in the highest returns on investment and the lowest spam complaints and unsubscribes, the majority of emails sent in 2017 were manual. Litmus estimates that fewer than 5% of all marketing emails sent are automated, and our results from the second half of 2017 support this trend.
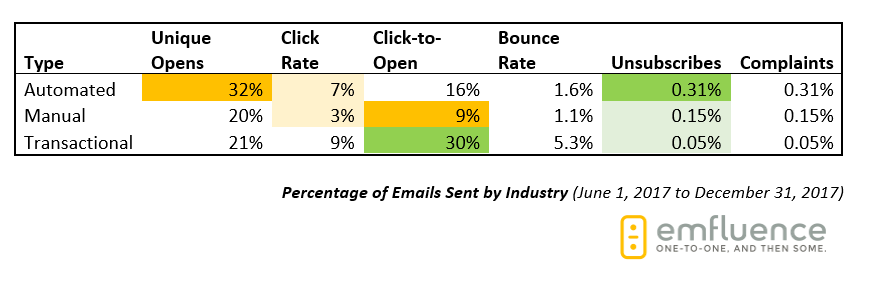
Even with a dip in unique open rates over the first half of 2017, automated emails continued to vastly outperform manual ones both in unique opens, clicks, and click-to-open rates. Manual rates also took a hit in click-to-open rates, which indicates that recipients were less likely to engage with those types of emails than they were with automated ones.
The Insurance industry sent the most number of manual emails in the latter half of 2017, while Education sent the most number of automated emails.
Averages for B2B and B2C Email Marketers
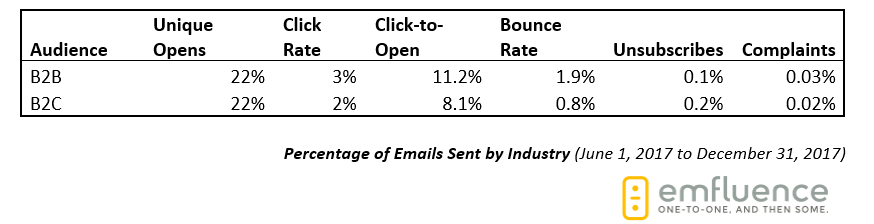
Across the board, B2B and B2C emails performed almost exactly as they did this time last year. Unique opens were slightly down for both B2B and B2C when compared with the first half of 2017, but click-to-open rates were fairly even and disengagement rates (bounces, unsubscribes, complaints) were identical.
B2B bounce rates are, however, higher than B2C’s. This should come as no surprise given the average B2B email list loses about a quarter of subscribers to job changes in a given year. Nonetheless, the slightly higher bounce rate also means that B2B companies should engage in regular list cleanses to clear out that normal loss.
Also of note in this year’s report: B2C recipients were 6 times more likely to forward an email than B2B recipients. Nice work with that sharable content!
What’s Next?
The statistics we provide in this report are designed to give you some basis for self-measurement. If you’re an emfluence Marketing Platform user, it’s easy to create custom Reports and schedule them for delivery to your inbox. With these reports, you can quickly compare your metrics to those we’ve included in this report. Plus, you can track landing page conversions, Contacts Growth, social media performance and more alongside your email metrics.
If you’re looking to dive into email reporting head first, be sure to read Krissy Head’s blog post on how to build a custom email reporting template here—she’s even include a downloadable version you can use right away.
Metrics definitions for our benchmarks:
Open Rate – Unique openers divided by total number of emails sent.
Click-through Rate – Total number of clicks divided by total number of emails sent.
Click-to-Open Ratio – Of those who opened the email, what percent clicked.
Bounce Rate – Total number of hard or soft bounces divided by the total number of emails sent.
Unsubscribe Rate – Total number of people who unsubscribed divided by the total number of emails sent.
Complaint Rate – Total number of spam complaints divided by the total number of emails sent.