Email Marketing Benchmarks Archive: June 2017
See the latest email marketing benchmarks here.
If you can’t measure it, you can’t improve it. Measuring is the mantra of the digital marketer—it’s the determiner of a campaign’s success or failure and an influencer in where we put our dollars.
If you’re routinely reviewing your own email metrics, you’re off to a great start—and even better if you’re comparing your data year over year. But measuring your own data is just the first step. Without benchmarks to compare your numbers to, how do you know if what you’re doing is truly successful?
That’s why we like to take a twice-yearly look into email marketing metrics compiled by our emfluence Marketing Platform users. Compiling masses of data on who is sending what and how it’s performing provides a point of reference for your campaigns so that you can evaluate how your email marketing metrics compare to others in:
- Your industry
- Your audience
- Your messaging style
Each of these reports compiles the unique open rate (unique views divided by total recipients), click rate (total clicks divided by total recipients), click-to-open rates (unique clicks divided by unique views), bounce rates (percentage of hard or soft bounces from total recipients), unsubscribe rate (number of people who unsubscribed out of total recipients), and complaint rate (total number of spam complaints in total recipients).
Let’s dig in.
Average Email Marketing Metrics by Industry
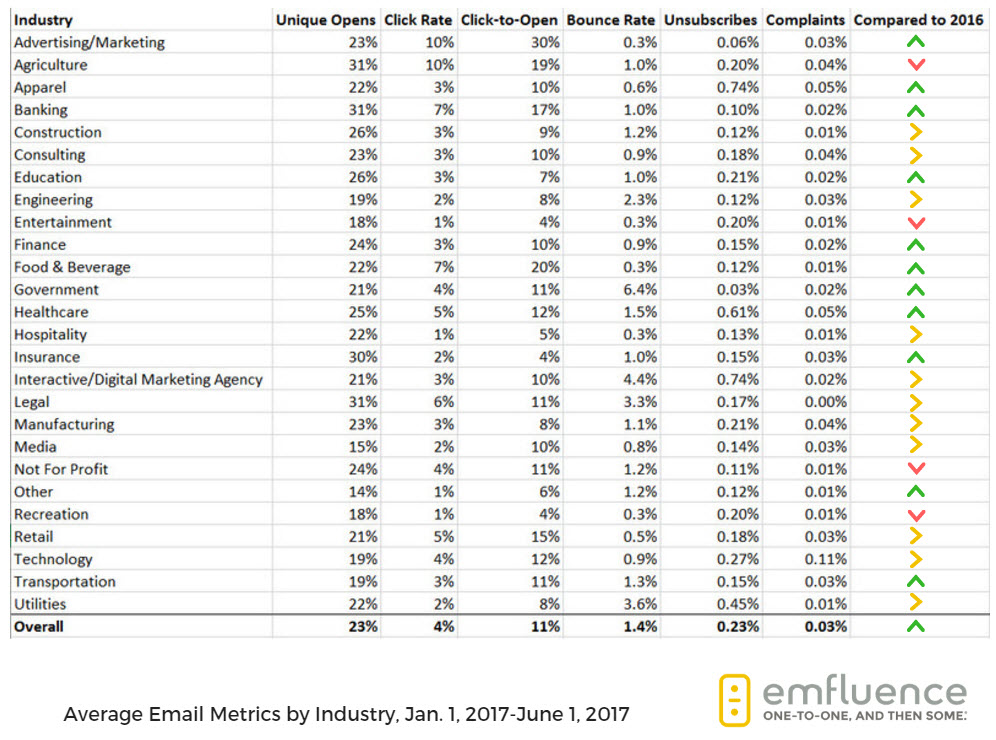
Across all industries, the average open rate in the first half of 2017 was 23%. Legal, Banking and Agriculture saw the highest open rates, with all three tied at an average of 31%, while Media and Other had the lowest, with open rates of 15% and 14%, respectively.
Open rates are important, but they aren’t nearly as telling as engagement rates. Interestingly, open rates dipped slightly across a number of industries when compared to the same time period in 2016, but most industries saw a positive spike in their click-to-open rates—this could be reflective of segmented email or opt-in strategies that would create a more engaged subscription base rather than blanket email campaigns that send indiscriminately to anyone, and thus tend to have lower engagement.
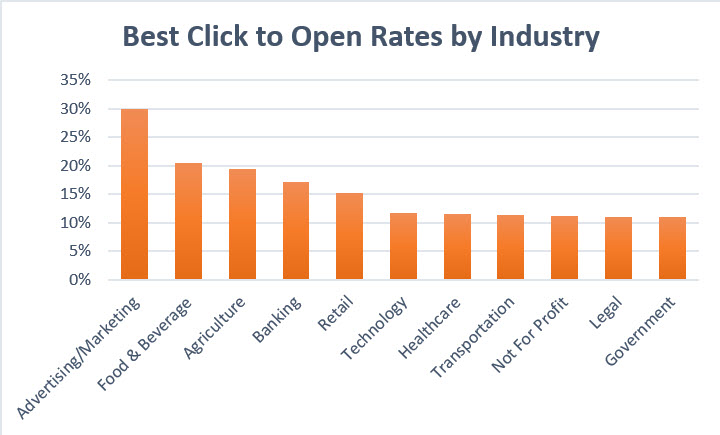
When measuring engagement, take a close look at click-to-open rates, as those are measuring unique clicks from unique viewers. Advertising/Marketing and Food & Beverage had the highest click-to-open rates in the last six months, with Advertising/Marketing averaging 30% and Food & Beverage averaging 20%. At the bottom of the scale, Recreation, Insurance, and Entertainment all saw 4% click-to-open rates.
We can also measure the annoyance factor by industry—in other words, who was most likely to have audience members that weren’t interested in engaging. At the top of the list, Apparel and Interactive/Digital Marketing Agency had the highest unsubscribe rates at 0.7%. The vast majority of industries saw unsubscribe rates right around 0.1%, and only Technology triggered complaints upwards of 0.05% (theirs was 0.11%).
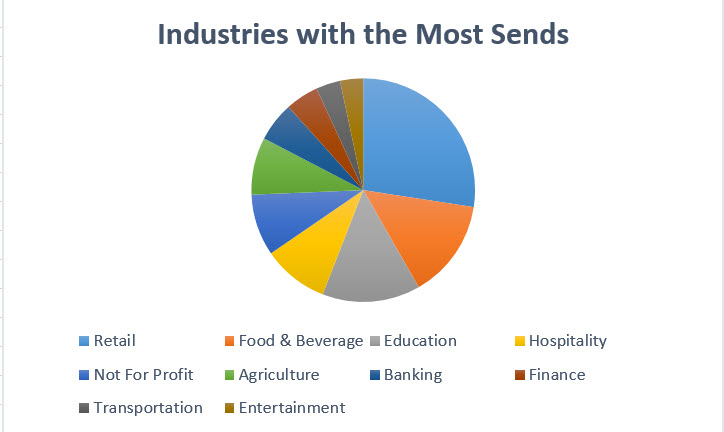
We also measured the biggest proportion of sends by industry. The biggest slice of the pie goes to Retail, with more than 7 million recipients sent to in the first half of the year.
On the far column, we’ve added a field to demonstrate how each industry’s numbers compare with the same time frame (1/1/2016 to 6/1/2016). These arrows indicate whether the industry’s overall open, click, and click-to-open rates went up, down, or stayed level. On the whole, eleven industries saw improving numbers, four saw their numbers decrease, and eleven were about the same.
Averages for B2B and B2C Email Marketers
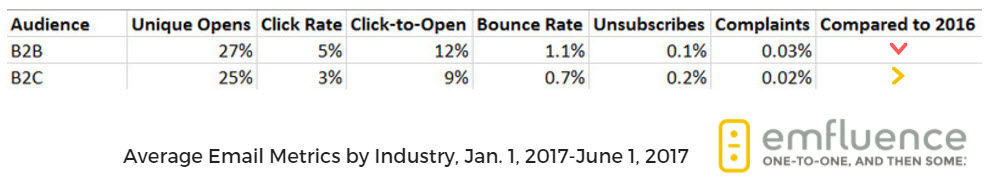
The numbers are largely mixed for both B2B and B2C senders this year. Interestingly, open rates and click-to-open rates for both B2B and B2C marketers were essentially flat from this time last year, and click rates were actually down. This could signal that subscribers aren’t as enticed by the offers as they were last year, or it could be time to try something a little different (i.e., try changing up the text on a button from Read More to why they should read more or winnow down the click options from bunches to one). A/B test away, marketers!
B2B had a much higher bounce rate and a slightly higher complaint rate when compared to B2C. With that said, the good news is that B2B bounces were down from last year’s numbers. Unsubscribes and complaints were unchanged for B2B and B2C from this year to last.
Averages for Automated, Manual, and Transactional Sends
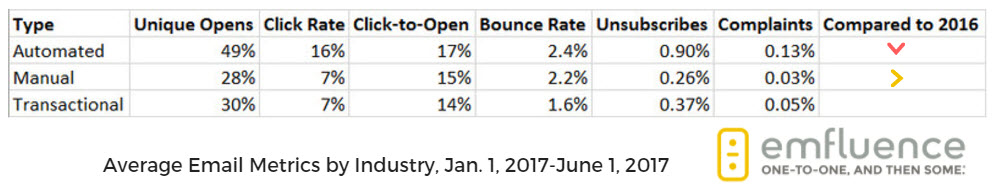
This report looks at the success of automated emails, manual emails, and new to our list, transactional emails (yes, we can do this, too!). True to history, automated emails are way outperforming manual emails on opens, but manual emails have leveled out with clicks and click-to-open rates.
Broken down by industry, the bulk of manual emails are being sent by Insurance, Retail, Hospitality, Education, Agriculture, and Finance. Education, Banking, and Hospitality are the biggest automated email senders, and Food & Beverage and Retail are the biggest senders of transactional emails.
Typically, an automated email is an early funnel activity, which could explain why open rates are so high but click-to-open rates are nearly level with manual sends. If your automated email open-to-click rates look like this or if your click-to-open rates are below average, consider running complimentary social media brand awareness campaigns (custom audiences) to the automated email list or industry you’re targeting as an extra touchpoint.
This is the first year we’ve reported on transactional emails, and it will be interesting to see how these types of emails perform in the reports to come!
What’s Next?
Keep in mind these statistics are helpful placemarkers for you to evaluate the success of your emails, but you may want to add in additional features based on your products, your email segments (particularly if you run unique campaigns to each segment), or the purpose of your emails (e.g., newsletters, nurtures, content downloads).
If you’re already using the emfluence Marketing Platform, you can customize Reports and set them to automatically send on a schedule that works for you. This is a really convenient way to keep track of your numbers and see how they compare to each other and to industry standards. These reports will even track list growth and the performance of your social media messages in tandem with your email campaigns. (If you need help setting these up, ping us at support@emfluence.com).
emfluence Marketing Platform users, you can also learn how to track your averages and parse your best performers by reading more on in our help section here.
If you’re looking to dive into email reporting head first, be sure to read Krissy Head’s blog post on how to build a custom email reporting template here—she even includes a downloadable version you can use right away.