Email Marketing Benchmarks Archive: December 2019
See the latest email marketing benchmarks here.
The holiday season is over and emailers, we’re moving into not just a new year, but a new decade. In the last decade, email marketing took a strong foothold as one of the top marketing channels for both B2B and B2C marketers. Email hasn’t been without its own set of challenges (including the seemingly ever-present chant that email is dead), but we can safely say that research indicates that 72% of U.S. adults actually prefer their communications with a brand to come via email.
It gets better than that, email marketers. We’ve learned a lot this decade about how important email marketing is to our overall marketing strategy. Next time someone tells you that email is dead, let them know that according to MarketingSherpa’s research, 91% of people like receiving emails from companies they already do business with, and that 49% of people say brand emails help them stay up-to-date with the latest offers and new products.
As we move into the new decade, there are lots of exciting updates and changes to look forward to in email. From dynamic images to preview panes, interactive content, super personalization and more, email is headed into new level of awesomeness. But before we get too far into this decade, let’s take a look at the second half of our 2019 Email Marketing Benchmarks Report, which runs from July 1, 2019 through Dec. 31, 2019.
Average Email Marketing Metrics by Industry
Given the influx of holiday emails that hit inboxes from November to December (and we even saw a few as early as October!), it should come as no surprise that the second half of the year saw a dip in email opens and engagement across all industries:
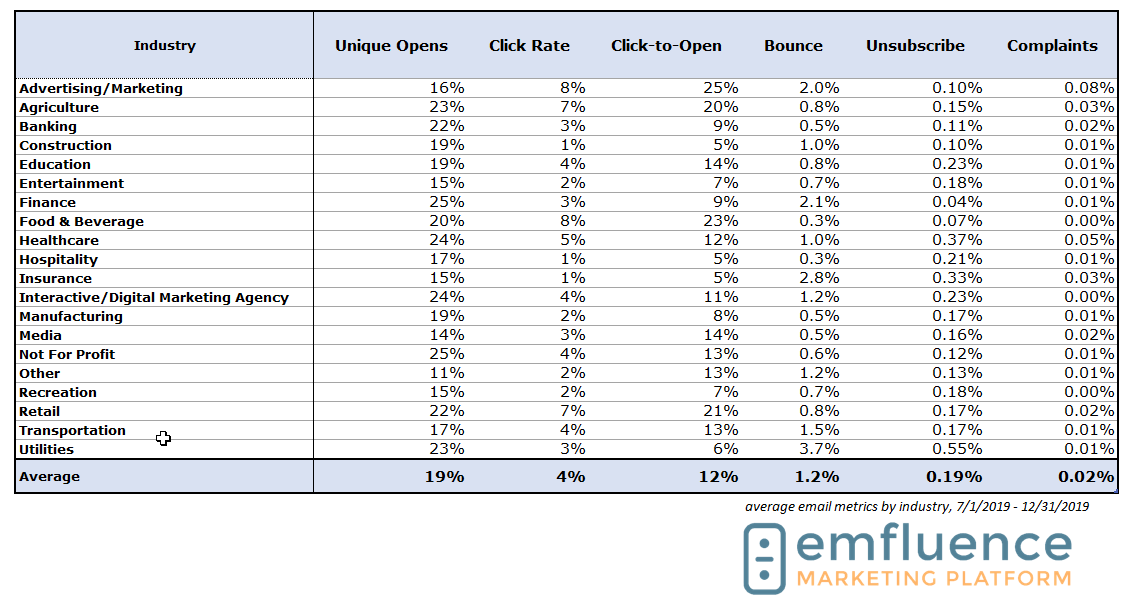
In the industries that send the most during the holiday season (Retail, Entertainment, Not for Profit), open rates stayed remarkably consistent. Perhaps a sign that we’ve grown accustomed to receiving the best offers and announcements during the year end season? Industries with no direct connection to holiday sales, however (Advertising/Marketing, Agriculture, Banking) saw slight dips in their open rates overall—which is a consistent drop with the same time frame in 2018 (July 1, 2018 through Dec. 31, 2018).
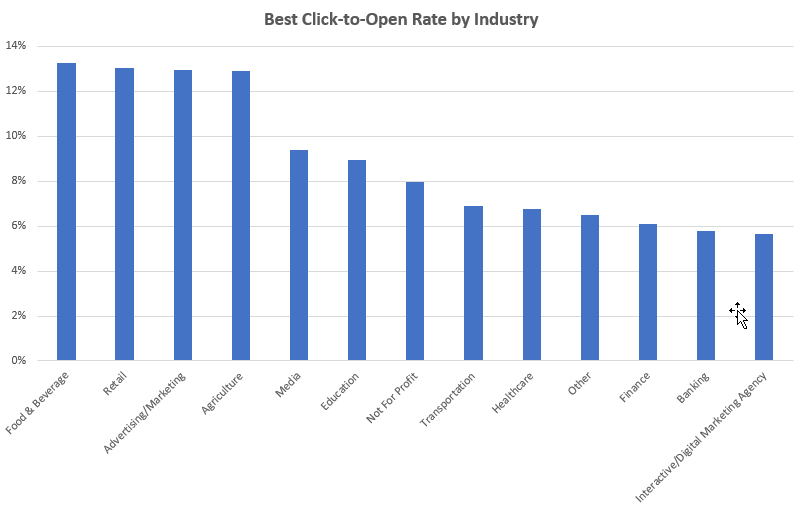
We track open rates as measures of interest and clickthroughs and click-to-open rates as measures of engagement. In looking at this report’s engagement metrics, a few industries saw a nice jump over the first half of 2019 in terms of how engaged their recipients were with their messaging. In Education, click-to-open rates jumped from 10% to 14% in this report. Entertainment, which can see a spike in interest with the holidays, saw engagement jump from 5% to 7%. Most impressive, however, is that Retail kept a consistent open rate and saw an increase in engagement from 16% to 21% in this report—in case there was any doubt as to how important an email strategy is to your holiday shopping success, let this metric put that debate to rest.
Not every industry was a winner in engagement for the second half of 2019, however. Healthcare fell from 17% in click-to-open rates down to 12% in this report, and Manufacturing dropped slightly from 10% to 8%.
In other industry news, Advertising/Marketing could use a list cleanse, with a jump in their bounce rates from 0.9% in our last report to 2% in this report, and so could Utilities (3.7%) and Finance (2.1%)—get those customer lists up-to-date! The highest unsubscribe rate in this report went to Utilities as well (0.55%), and across the board, despite the high sends in the second half of the year, complaints were way down (0.07% to 0.02%) overall.
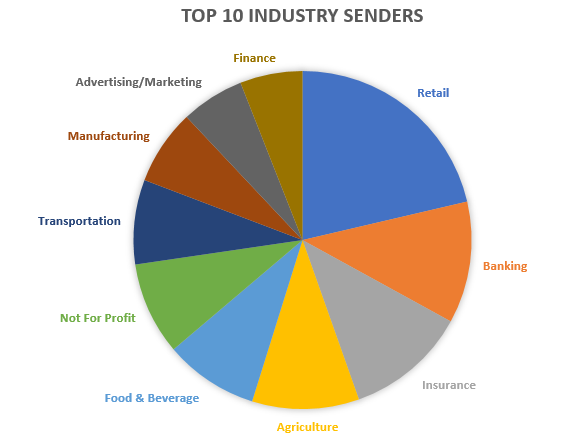
As we look at which industries are sending the most emails, Retail tops the list once again (no surprises here), with Banking, Insurance, and Agriculture in a three-way tie for second place:
B2B Email Marketing Metrics
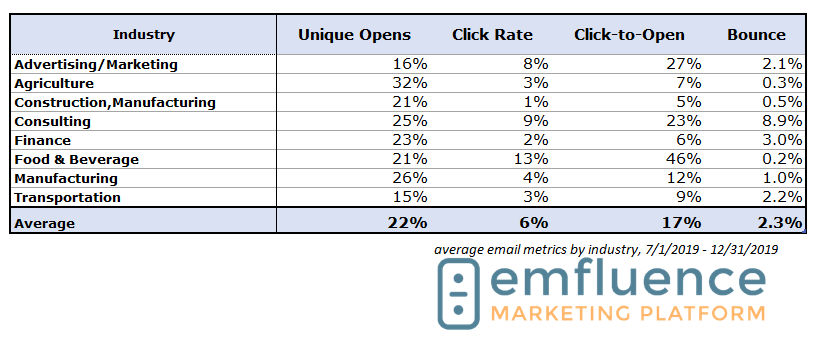
In our first half of 2019 Email Marketing Benchmarks Report, we added B2B-specific metrics. B2B email marketers have their own sets of challenges (Outlook, for starters), and we wanted to add a level of reporting here to help B2B marketers get a sense of their email strategy successes. We’ll be digging into these stats deeper in reports to come.
The best B2B open rates in the second half of 2019 go to Agriculture and Manufacturing, but it’s Food & Beverage and Advertising/Marketing who are winning the engagement metrics:
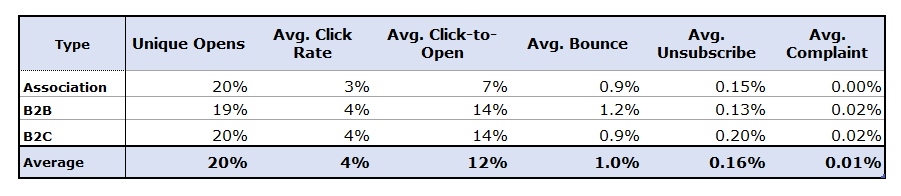
Dig a little deeper, and you can see how B2B metrics overall compare to B2C metrics and Association metrics:
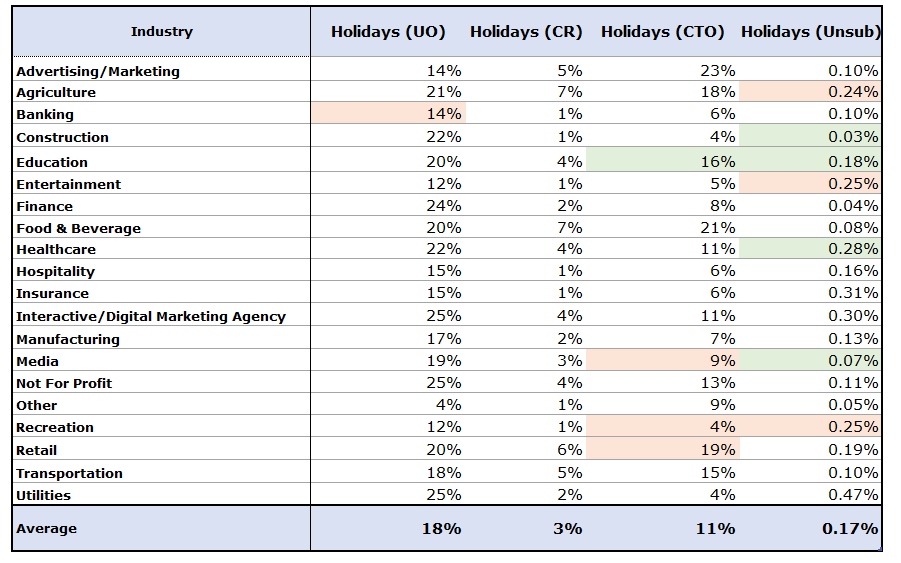
Impact of the Holiday Season
During the second half of the year, we like to dig in a little deeper to what our email marketing benchmarks look like between November 25th and Dec. 31st. It’s during this time frame that we would expect higher volume from Entertainment, Food & Beverage, Retail, and Not For Profit, and with that higher volume, there can be an occasional dip in engagement and interest metrics. Retail saw a slight dip in overall engagement metrics during the holiday season, as did Recreation and Media, whereas Education saw a surprising increase in engagement—perhaps indicating the success of seasonality in new student campaigns.
Don’t Love Your Email Results?
Averages for Automated, Manual, and Transactional Sends
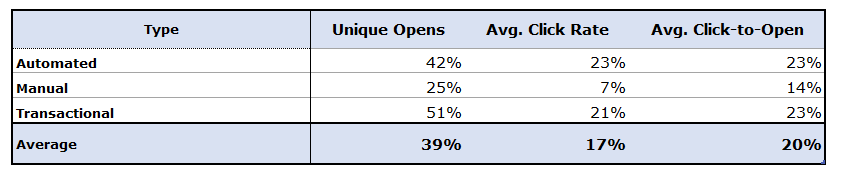
Automation is still underutilized, but this year’s report indicates that the B2C crowd is beginning to automate at a quicker rate than the B2B crowd. In the second half of 2019, 17.8% of automated emails sent out were B2B campaigns, whereas 82.2% were B2C campaigns. By comparison, 23% of manual emails sent were B2B emails, whereas 45% were B2C emails.
Compared to the first half of 2019, engagement in automated emails continues to be strong and growing stronger. Total clicks on automated emails jumped from 10% to 23% in this report—which indicates that people are returning to an email several times over. Manual email engagement and interest rates are pretty flat in this report, and as transactional emails continue to gain steam, open rates jumped from 42% to 51% in this report.
Conclusions
2020 is a new decade of email, with lots of new design tactics and personalization options to try. As you prep for your email strategy moving forward, we recommend the following resources to keep you up to speed:
- Really Good Emails offers really good design guides for every type of email in your strategy. Visit their site here: https://reallygoodemails.com/
- Email on Acid offers more technical guides for email: https://www.emailonacid.com/blog/
- Subscribe to our email and marketing automation strategy newsletters, including our new Email Tip of the Month, where we provide interactive email design ideas each month: https://more.emfluence.com/subscriptions
Got a strategy question or shopping for a new marketing automation platform? We’re here for that, too. Just drop us a line in the contact form below. Happy 2020 emailing, email friends!
Metrics definitions for our benchmarks:
Open Rate – Unique openers divided by total number of emails sent.
Click-through Rate – Total number of clicks divided by total number of emails sent.
Click-to-Open Ratio – Of those who opened the email, what percent clicked.
Bounce Rate – Total number of hard or soft bounces divided by the total number of emails sent.
Unsubscribe Rate – Total number of people who unsubscribed divided by the total number of emails sent.
Complaint Rate – Total number of spam complaints divided by the total number of emails sent.
See our archived email marketing benchmarks:
June 2019
December 2018
June 2018
December 2017
June 2017
December 2015
June 2015
December 2014
Ready to get started?