Email Marketing Benchmarks Archive: June 2019
See the latest email marketing benchmarks here.
Heading into the second quarter of 2019, economic forecasts suggested a slight slowing of the growth rate, underscored by uncertainty about foreign trade policy, tariffs and consumer confidence. Also of concern were the impact of unseasonably cold (and long) weather and consternation about what the Fed would do with interest rates. Despite the uncertainty, the U.S. economy remained stable with continued, albeit slower, growth and consumer confidence remained high.
While we don’t claim to use email metrics as a lagging economic indicator, we do review customer engagement metrics in light of the larger economy – and so far, we like what we’re seeing. Let’s take a look at email metrics from the first half of 2019:
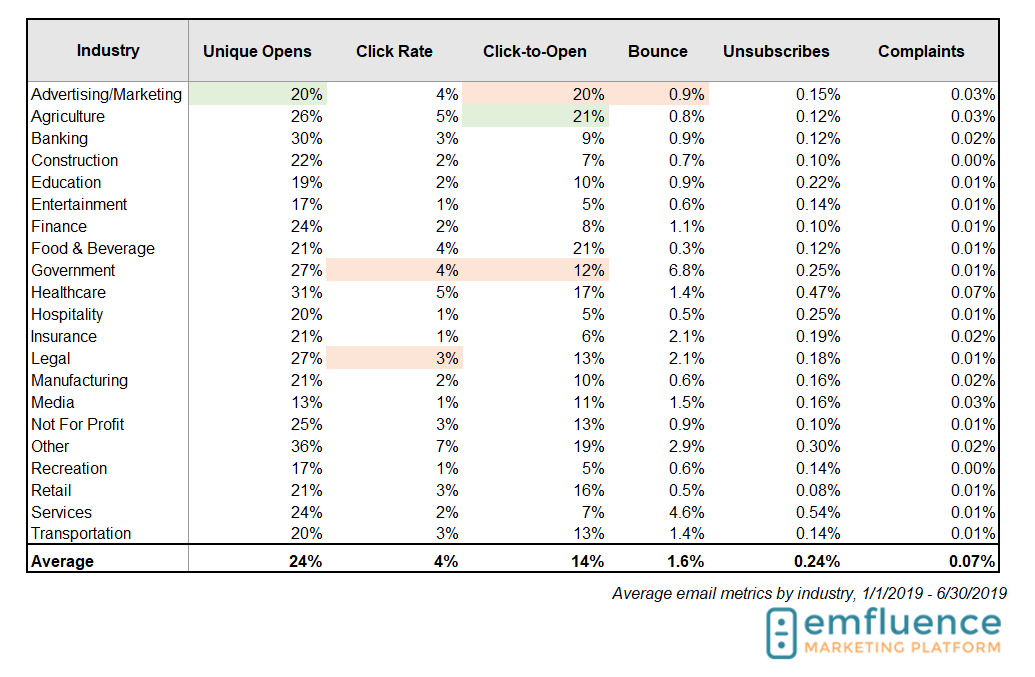
Average Email Marketing Metrics by Industry
Overall, customer behavior seems to be consistent with the recent consumer confidence reports, with open rates in key industries consistent with the same period of time in 2018 (January 1 – June 30). Despite the lingering cold weather, which can postpone demand in consumer vehicle loans and large agricultural equipment, both the Banking and Agriculture industries were able to maintain engagement with their target audiences, earning 29% and 26% open rates, respectively. After a rough second half of 2018, Advertising/Marketing bounced back to a 20% average open rate, although the average click-to-open rate fell from an impressive 29% to a still impressive 20%.
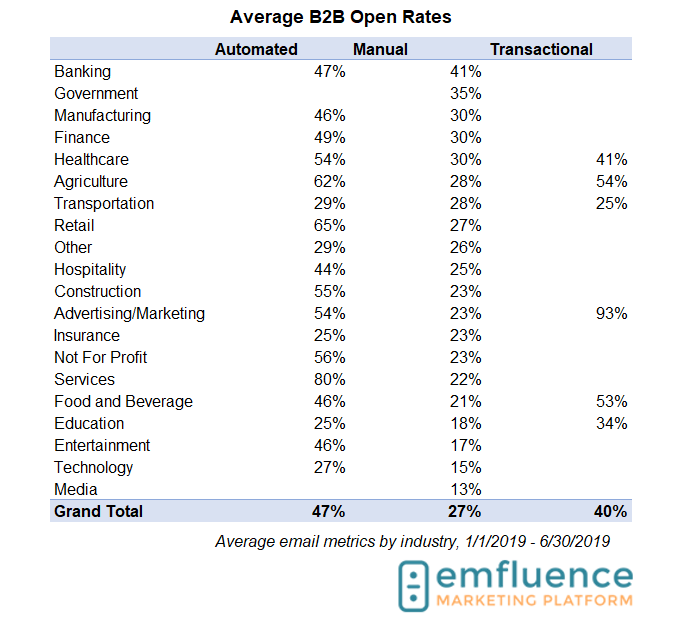
B2B Email Marketing Benchmarks
B2B email performed well in the first half of 2019, with 18 key industries achieving open rates greater than 20%. Automated emails in B2B continue to show very high open rates, with eight industries achieving greater than 50% open rates. Not for profit and services are up 4% and 3%, respectively. Government emails dipped to a still very respectable 31% from 38% same quarter last year. Insurance dipped to 25% open rates.
What are B2B Marketers Doing So Well?
The B2B marketers that achieved the highest engagement had a few things in common.
- Highly segmented audiences. The companies that we reviewed used segmentation strategies to tailor their messaging to smaller, unique audiences.
- Ongoing, regular engagement. They maintained a consistent cadence of communication, delivering on customer expectations with pertinent messaging.
- Timely, relevant content. They content was not only targeted, but highly relevant. Seasonality, cyclicality and trend-monitoring content all performed well.
Don’t Love Your Email Results?
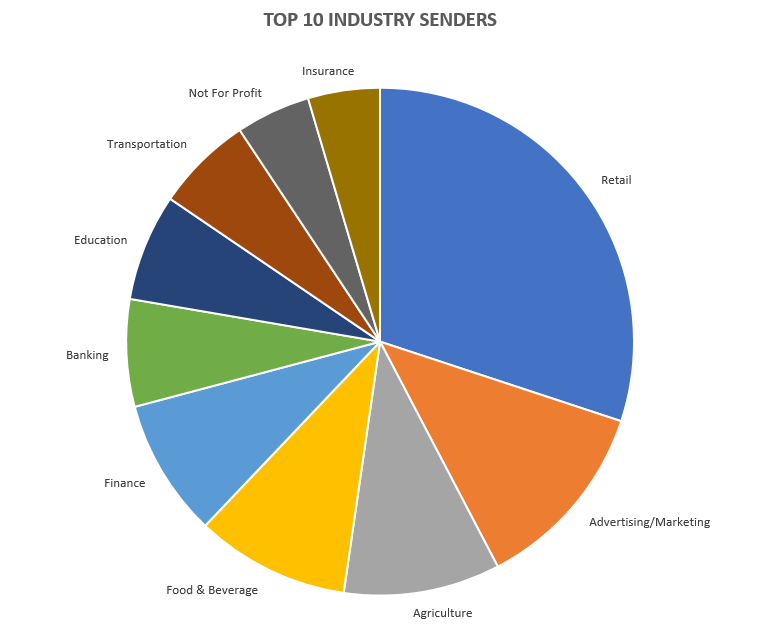
Most Email Sends by Industry
Retail maintained its dominance as the industry with the greatest volume of email sends in the first half of 2019, followed by Advertising/Marketing and Agriculture. Keep in mind these are not industries with the biggest lists—rather, these are the industries sending the greatest number of emails over time. Note that consumer-facing industries are common on this list, but that doesn’t mean B2B email can’t play a greater role in the customer lifecycle.
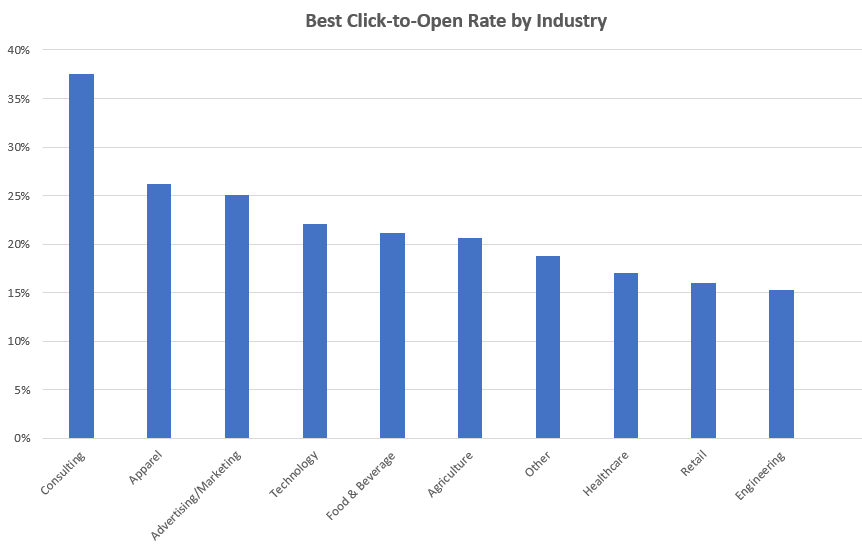
Email Engagement by Industry
The best measure of engagement with an email is the click-to-open rate. In other words, what action is the email driving, and are the recipients taking that action. When we look at the best click-to-open rates by industry in the first half of 2019, the previous industry winner—Advertising/Marketing—has been unseated by Apparel and Consulting. To improve click-to-open rates, be sure that you’re sending emails with a clear, primary call to action and that the emails you’re sending are ones your recipients have asked for.
Averages for Automated, Manual, and Transactional Sends
We’ve been saying for years that the best performing emails are ones that are timely, relevant, and anticipated. A look at 2019’s automated and transactional email metrics are proof enough:
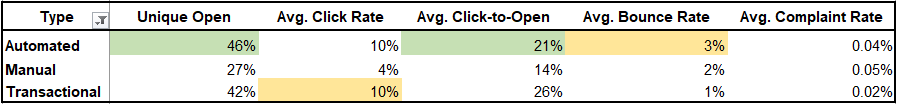
Automated email open rates jumped from 41% in the second half of 2018 to 46% in the first half of 2019, and the average click-to-open rate for an automated email jumped from 16% to 21% in the same timeframe. Automated emails tend to work off of behavioral or time-sensitive triggers, which means they are often among the most engaging and top performing types of emails.
No surprises that transactional emails are also performing well, with an average open rate of 42% and an average click-to-open rate of 26%. Remember that these emails have special rules for how much marketing content they can contain, so do your research before you send them.
Metrics definitions for our benchmarks:
Open Rate – Unique openers divided by total number of emails sent.
Click-through Rate – Total number of clicks divided by total number of emails sent.
Click-to-Open Ratio – Of those who opened the email, what percent clicked.
Bounce Rate – Total number of hard or soft bounces divided by the total number of emails sent.
Unsubscribe Rate – Total number of people who unsubscribed divided by the total number of emails sent.
Complaint Rate – Total number of spam complaints divided by the total number of emails sent.
Ready to get started?