Email Marketing Benchmarks Archive: June 2015
See the latest email marketing benchmarks here.
It’s hard to believe, but we’re halfway through 2015! As of this week, I wanted to revisit the most recent benchmarks for open rate, click-through rate and more, based on the real aggregated data from senders via the emfluence Marketing Platform. There are some noteworthy changes since the January – December 2014 benchmarks. First, a look at benchmarks by Industry:
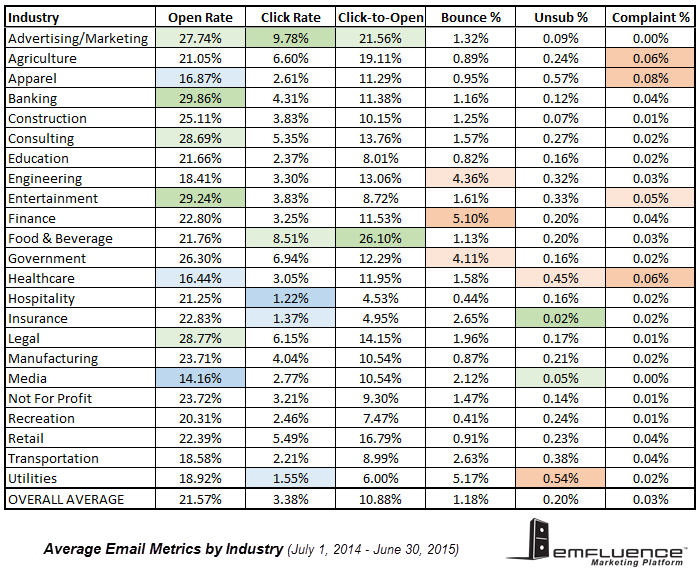
Highlighted in green, the best open rates were from the Entertainment and Banking sectors, which were both top 3 performers last year. Then, the Legal industry also trends well, with 28.77% — still 33% over the overall average open rate of 21.57%. Media — typically sent more often than brand email — was the lowest average open rate with just 14.15%.
Advertising/Marketing and Food & Beverage emails had the best click-through rates and click-to-open ratios, more than double the overall averages for both. Conversely, Hospitality (hotels, restaurants) typically had the lowest click-through rate, possibly because their product is offline, so calls to action may be for offline conversions.
The Finance sector had the worst bounce rate, with an industry average over 5%. Typically, 5% is a threshold for deliverability issues — inbox placement can start to suffer.
Utilities had the highest unsubscribe rate, which is especially odd given that we think of those as required purchases. This encompasses any product in that sector, too, though. Healthcare suffered a higher than average unsubscribe rate and the highest complaint rate of any industry, but both numbers are down on average from 2014.
Don’t Love Your Email Results?
Download the anatomy of a marketing email template
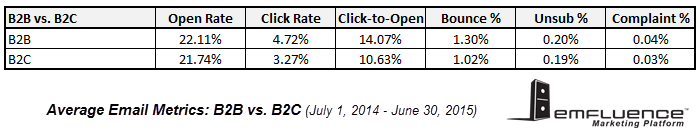
Another shift we noticed was that whereas with 2014 benchmarks, we noticed very little difference between business-to-business and business-to-consumer email marketing benchmarks, from July 2014 to June 2015, B2B email averaged over a 40% higher click-through rate and over a 30% higher click-to-open ratio. They also suffered a higher bounce rate and slightly higher unsubscribe and complaint rates, though.
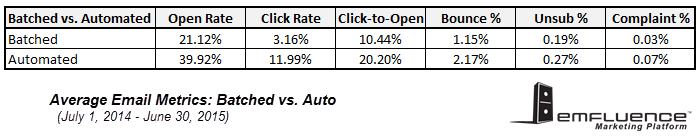
Unsurprisingly, automated or triggered emails still outperformed batch and send emails 2-to-1 in open rate and nearly 4-to-1 in click-through rate. Unfortunately, they also tend to have double the bounce, unsubscribe and complaint rates. Typically automated emails outperform batched emails in conversions, too, making them very powerful.
Email Marketing Benchmarks by Device
As the email marketing world touts mobile open rates, it’s more important than ever to know where your subscribers are opening and engaging with your emails. Benchmark metrics are flying around saying that 50-65% of all email is opened on a mobile device… And that’s true, for some marketers.
At the 2015 emfluence User Conference, I spoke on the trends in email marketing. How could I not talk about the impact of mobile? But in looking at our own benchmarks — from those marketers who use the emfluence Marketing Platform to send their emails — I noticed something different from the national trend. Larger, national retail brands are definitely seeing as high as a 70-72% mobile open rate. Nearly three-quarters of their opens are on mobile devices!
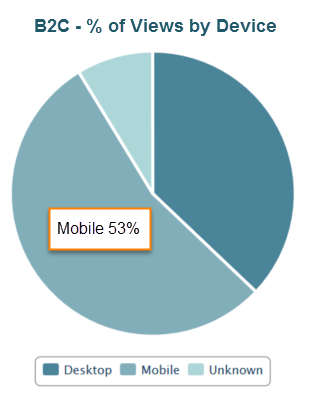
For brands with regional audiences, smaller list sizes or an older subscriber base, though, the mobile open rate was lower. In fact, for all business-to-consumer senders, on average 53% of opens were on mobile devices. That’s still enough to make you want to take note of mobile design best practices.
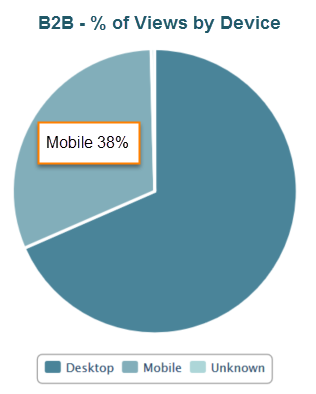
Even more interesting, though, is the difference in business-to-business senders. In 2014, I saw that the average mobile open rate for B2B email marketers was barely 20%. In 2015, one of the big trend shifts is that now 38% of B2B emails are opened on a mobile device, almost 200% growth year-over-year.
So mobile is taking over, right? It’s definitely going to make its mark on your success and you’ll want to plan for a mobile-friendly design, even if you don’t code and design an entire mobile version or a mobile-responsive email. (Check out 9 GIFs that explain responsive design brilliantly.) But is that the entire story?
Some — or many — of your subscribers are reading your emails on mobile. But where are they taking action? In the emfluence Marketing Platform, you can not only track your open rate by device, but also your click through rate by device. And those numbers offer some insight, too. Just because your mobile open rates are up, doesn’t mean that’s where your readers are taking action.
Mobile click throughs still don’t make up even half of all clicks for almost any industry, floating around 30% for business-to-consumer brands and a meager 10% for business-to-business brands. Mobile readers are more likely to click through on an article or video than a form or survey that they’d have to fill out on their smaller screen. Retail tends to keep a slightly higher percent/ratio of mobile in their click throughs, which can be optimized by having a mobile friendly experience when shoppers click through.
Somewhat predictably, your younger subscribers are more likely to open on a phone or tablet. Here’s one example from a retail marketer who has appended demographic data to their subscriber list and can see the impact of subscriber age on mobile engagement:
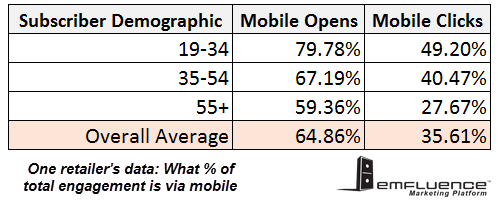
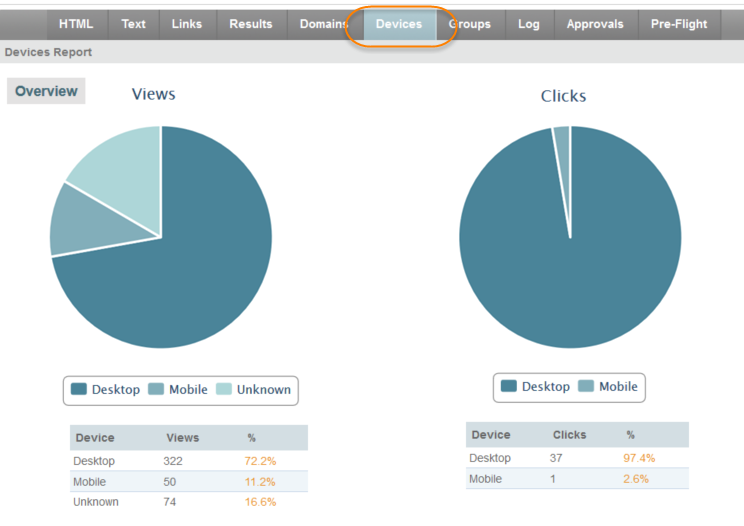
This is, of course, just one brand’s metrics; an example. Mobile open rates and mobile click-through patterns can differ greatly depending on your audience, so be sure to watch your own metrics. emfluence users, find your mobile metrics on the Devices tab in your message report:
Metrics definitions for these benchmarks:
Open Rate (a.k.a. View Rate) – Unique openers divided by total number of emails sent.
Average Open Rate = 20-25%
Click-through Rate – Total number of clicks divided by total number of emails sent.
Average Click-through Rate = 3-4%
Click-to-Open Ratio – Of those who opened the email, how many clicked?
Average CTOR = 10-12%
Bounce Rate – Total number of hard or soft bounces divided by the total number of emails sent.
Average Bounce Rate = 1-1.5%
Unsubscribe Rate – Total number of people who unsubscribed divided by the total number of emails sent.
Average Unsubscribe Rate = 0.2%
Complaint Rate – Total number of spam complaints divided by the total number of emails sent.
Average Complaint Rate = 0.03%
Ready to get started?