Email Marketing Benchmarks Archive: December 2018
See the latest email marketing benchmarks here.
With peak email season behind us and a fresh year of metrics on the horizon, it’s time to take a look at how email marketing campaigns performed for the second half of 2018.
If this is your first Email Marketing Benchmarks Report, welcome to the emfluence Marketing Platform’s twice-yearly review of email marketing metrics compile by our users across the globe. In each report, you can evaluate email marketing benchmarks by industries, audience types, and messaging styles. Use these numbers to benchmark your email marketing campaigns and let us know in the comments section what you’re seeing, too.
Let’s look at how the second half of 2018 shaped up for our email marketers:
Average Email Marketing Benchmarks by Industry
At this time last year, our Email Marketing Benchmark Report focused on the impact of holiday emails—namely, how the influx of emails around the holiday season can negatively impact engagement rates across all industries. Fortunately, things settled down for the first half of 2018.
This year, however, the impact of the holidays seemed to have little effect on most industries in our report:
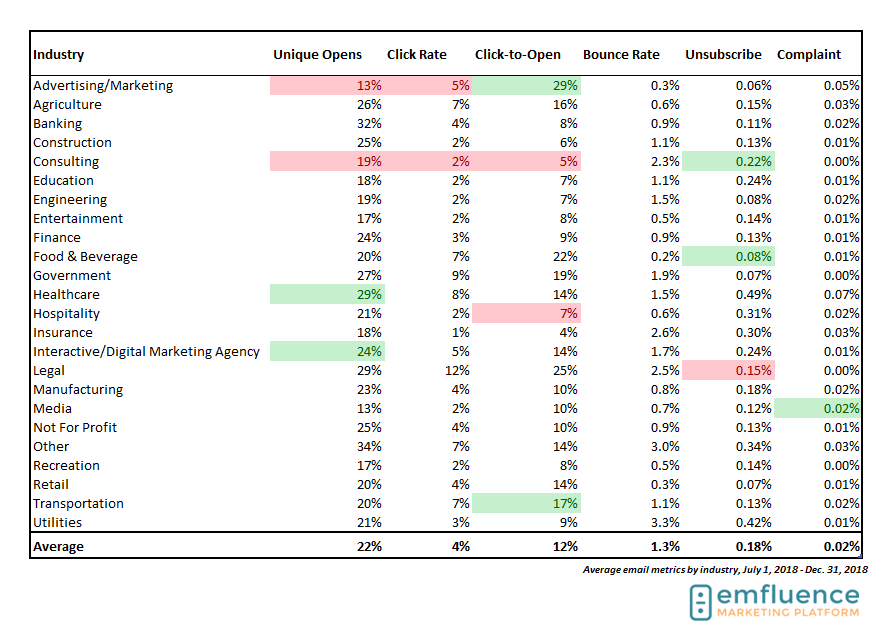
In the chart above, red indicates a percentage that is lower than the previous six months (or in the case of bounces, unsubscribes or complaints, a number that is higher than in previous months), and green indicates a higher percentage from previous months (or in the case of bounces, unsubscribes or complaints, a number that is lower than in previous months).
Despite the slew of holiday-related emails (B2B and B2C), most industries maintained their unique opens, click rates, and click-to-open rates from the first half of 2018. Across all industries, there was an ever-so-slight lowering of one percentage point for unique opens, click rates, and click-to-open rates, with few industries showing significant changes from the previous report. One notable improvement overall, however, is the drop in unsubscribes from 0.24% in the first half of 2018 to 0.18% in the second half. Way to go, marketers, for sending more relevant emails!
Email Engagement by Industry
Although most industries saw no change from the first half of 2018, two industries saw marked change in their unique open and click rates. Advertising/Marketing, which is categorized separately from Interactive/Digital Marketing Agency, had a drop in unique opens from 22% to 13% (down even from the all-time average of 18%), and a drop in the click rate (how many times each email was clicked overall) from 9% to 5%. This could indicate some work is needed on the subject lines/pre-header text, or that the lists aren’t as active as they might be in other industries. One thing to note, however: Advertising/Marketing did see a four-percent jump in the click-to-open rate, which could indicate that the people who are interested in receiving the messages are engaged with the content, and overall, Advertising/Marketing has the highest click-to-open rate of all industries in our benchmarks report.
Consulting struggled in the second half of 2018 as well, with drops in unique opens (down six percentage points from the last report), clicks (down six percentage points from the last report), and click-to-open rates (down 15% from the last report). With swings like this in percentages, it helps to look at the all-time averages. All-time, Consulting averages a 23% open rate and a 5% click rate. Swings generally indicate some seasonality to the sending industry, in which case, it’s helpful to benchmark your metrics to both a short and long timeframe. Hospitality saw a similar dip in engagement, which also appears seasonal: for the second half reports, this industry tends to average a lower click-to-open rate year over year than in the first half reports.
Healthcare is on an uptick in open rates, up to 29% in this report over their all-time average of 25%. Retail had a nice close to 2018 as well—in spite of the fact that holiday seasonality can impact email open rates for retail brands, Retail held strong with no real change in opens or clicks.
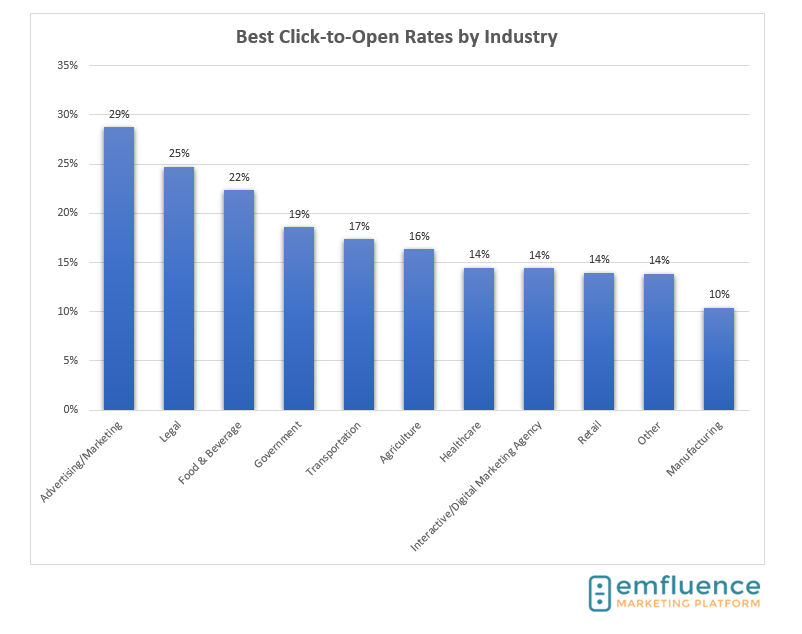
When we discuss engagement, one of the key metrics we’re looking for is click-to-open rate—this is the percentage of unique opens and unique clicks that can help us understand if recipients are interested in the content they are receiving. Based on the chart above, Advertising/Marketing, Legal, Food & Beverage, and Government seem to be routinely sending content that subscribers want to engage with.
As a reminder, if you’re looking for ways to increase your click-to-open rate (and thus, your engagement), you can impact that rate by sending:
• Relevant content and/or specific, targeted offers to each audience
• Segment your lists based on interest
• Send at a reasonable rate per month (not too little or too often)
Most Email Sends by Industry
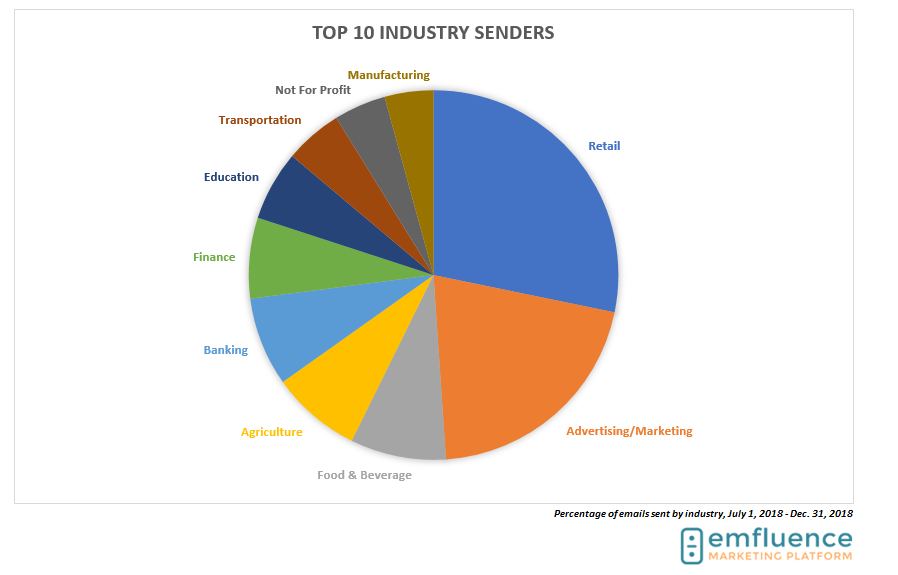
So which industries are sending the most email? Let’s take a look: Advertising/Marketing and Retail made up a good portion of the types of emails sent through the emfluence Marketing Platform in the latter half of 2018. Other industries to make it to the top ten? Finance, Banking, Education, Manufacturing, Transportation, Food & Beverage, Not for Profit, and Agriculture.
Bounces, Unsubscribes, and Complaints by Industry
Measuring bounces, unsubscribes, and complaints can help us email marketers understand what industries could work on messaging, list acquisition, and send strategies. This list tells us there’s room for improvement.
The industries most likely to trigger an unsubscribe were Healthcare and Utilities. Consulting, despite taking a hit on engagement, actually saw a slight decrease in the unsubscribe rate, as did Government. The industries most likely to trigger a bounced email address were Insurance, Consulting, and Legal (time for a list cleanse, if you work in those industries), whereas the cleanest lists belonged to marketers in Retail, Advertising/Marketing, Entertainment, and Recreation.
The Impact of the Holidays on Email Marketing
Let’s hone in on the months of November and December to see how the holiday season impacted email marketing benchmarks for some of our industries:
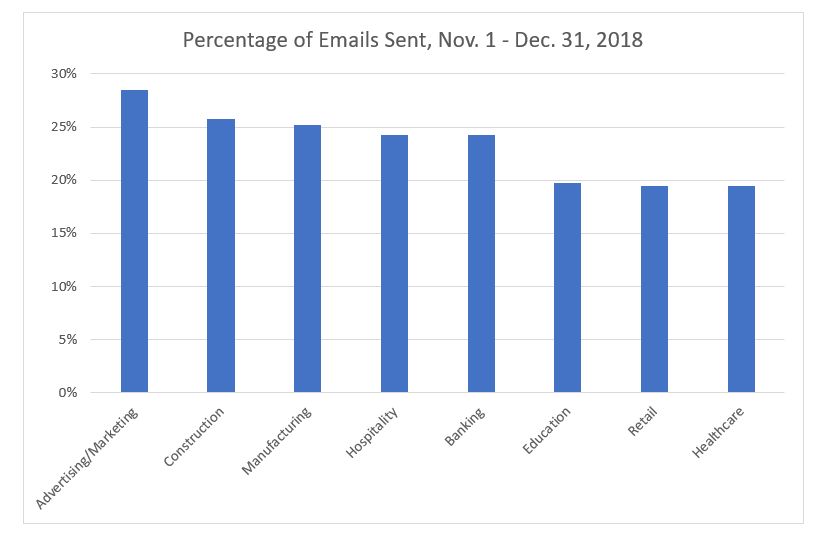
As could be expected, some industries have a need to send more emails during certain times of the year—in this case, the industries above sent on average a higher percentage of emails during the months of November and December than they sent in previous months. For Hospitality, Education and Manufacturing, the increased number of sends lead to a slightly higher open rate (24% during November and December for Hospitality, 25% for Manufacturing, and 20% for Education), whereas the increased number of sends for Healthcare saw a slight dip in opens (from 29% overall to 19% during November and December).
Across all industries, the holiday season had minimal impact on the overall average open rate, but the impact on click-to-open rates (i.e., engagement with the email’s content) was pretty significant:

In the above chart, average click-to-open rates from July to December are represented in orange, whereas average click-to-open rates for the months of November and December are represented in blue. Long story short: if your email engagement rates dropped during the last two months of 2018, you’re not alone! And you probably shouldn’t fret too much, either. With a steady influx of emails landing in inboxes during November and December, your offer and message have to be spot-on relevant to get your audience’s attention.
However, if you’re in Retail or send emails during the holidays that are designed to close sales or generate year-end donations (Not for Profit), you may want to consider an email strategy audit ahead of next year’s shopping season to make sure you’re putting forward relevant, attractive, conversion-friendly messages (we can help with that, by the way).
Averages for Automated, Manual, and Transactional Sends
We’ve been talking up the need for more automated emails in the mix for a few years now. Automated emails tend to have the highest engagement rates and the lowest number of spam complaints and unsubscribes, yet the benchmarks show that both B2B and B2C senders are still sending more than 95% of their overall emails as manual sends instead of automated messages. That’s in line with Litmus’ research that fewer than 5% of all marketing emails are automated—but that doesn’t mean there isn’t room for improvement.
Let’s take a look at the email marketing benchmarks for Automated, Manual, and Transactional type emails:
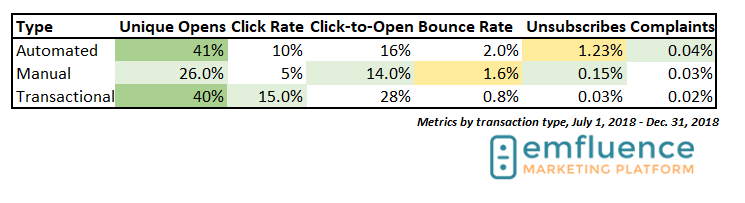
In the chart above, it’s clear that automated emails tend to out perform manual emails in terms of unique open rates, click rates, and click-to-open rates. And the numbers are on the rise: in our last report, automated emails averaged a 34% open rate and an 8% click rate—in this report, the open rate for an automated email has jumped by 7 percentage points. Automated emails tend to be more timely (because they don’t rely on a person hitting “send”) and segmented (because they tend to trigger off a specific action or set of characteristics), which is reflected in the difference in engagement between them and manual emails.
Check out the engagement rates for transactional emails—on average, transactional emails tend to have eight times as many opens as other types of emails. While you do have to be careful with the messaging you tuck into these confirmation-type emails, take note that you are allowed to slide a little marketing into the message. Just be sure you read the rules and follow directions (learn more about that here).
Curious how email send types shake out across industries? Advertising/Marketing averages more manual sends than other industries in our report, whereas the industry with the highest percentage of automated sends is Education.
Averages for B2B and B2C Email Marketers
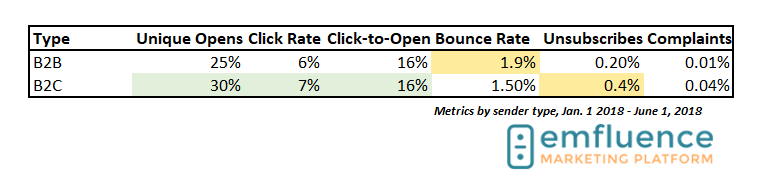
B2C marketers are slightly more likely to send an automated email than B2B marketers, and slightly more likely to have an email opened than B2B marketers (averaging a 30% open rate to B2B’s 25% open rate). On the whole, there’s still room for B2B marketers to keep running list cleanses, which is evidenced by a slightly increased bounce rate of 1.9% (remember, the average B2B marketing list loses 25% accuracy each year due to job changes, role changes, and retirement). As for B2C marketers, keep segmenting and sending relevant messages to your unique segments—that should help with the slightly increased unsubscribe rate of 0.4%.
2019 Email Marketing Trends
Now that we’ve looked back at 2018’s metrics, what should we look forward to in 2019? Here are a few hot items you should include in your 2019 email marketing plan:
- Automated Those Emails—not only will this make your life easier, but you can string together complex campaigns that make targeting and sending the right content at the right time so much easier.
- Milestone Emails—help you aggregate your customer data and spin it back through email in a way that’s creative, engaging, and demonstrates each of your customers’ unique value all in one spot. Learn more about them here.
- Keep Focusing on Engagement—meaning, create emails and offers your audience wants to receive, and test to make sure you aren’t sending too frequently or infrequently.
- Keep Segmenting Your Lists—targeted emails generate 58% of all email revenue, according to the DMA. It’s no surprise, either: people are more likely to buy things from you they’ve already shown an interest in.
- Add Transactional Emails to the Mix—and keep in mind that you are allowed to use a small portion of these highly engaging emails to market the extras.
- Create Abandoned Cart Campaigns—yes, even if you’re B2B (you can use ecommerce, too). Abandoned cart emails are amazing sources of almost-lost revenue. Learn more and try one out for yourself over on our t-shirt shop.
Metrics definitions for our benchmarks:
Open Rate – Unique openers divided by total number of emails sent.
Click-through Rate – Total number of clicks divided by total number of emails sent.
Click-to-Open Ratio – Of those who opened the email, what percent clicked.
Bounce Rate – Total number of hard or soft bounces divided by the total number of emails sent.
Unsubscribe Rate – Total number of people who unsubscribed divided by the total number of emails sent.
Complaint Rate – Total number of spam complaints divided by the total number of emails sent.